Category: Master
-
Multilevel Data Analysis
Day 94 Multilevel AnalysisContextual AnalysisMixed Effects Models Day 95 Tutorial Day 96 Data collected wronglyType of mistake occur Day 97 Variable Proposition Day 98, Day 98 (2) TutorialStatistical Treatment of Clustered DataMethod– Aggregation– Disaggregation Day 99, Day 99 (2), 101 (2), 103 DisaggregationHow to avoid? Using two-stage sample.Looking for correlationCorrelation Analysis (Intraclass Correlation-ICC)F-testLinear RegressionTotal Regression, Regression…
-
Day 106
Question 1 As a variable at the student level that is essential for explaining Economics score, we use the measure for revision hours per month taken from a study. The revision hours has been centered, so that its mean is 0. The results are presented below. Revision hours here is the variable with overall centering…
-
Day 105 (2)
Hypothesis Test t-test = sample size < 30, t distributionz-test = sample size > 30, z distribution For multi-level regression, t-test is different as needed to handle 2 level. ExampleModel 1 = grand-mean-centered IQ variable along with the group mean Model 2 = with-in group deviation variable Only Y01 is different between model Between group…
-
Day 105
Example Regression Line given by Yij = 41.13 + 2.4801 IQij + 1.029 IQ (meanj) + Uoj + U1j IQij + RijStandard Deviation of random slope “Language Score” = √0.195 = 0.44Average slope = 2.480 Correlation between random slope and random intercept = -0.83/√(8.88×0.195) = -0.63The negative correlation means that classes with a higher performance…
-
Day 104
Question 1 Compare the Multiple Linear Regression (MLR) and Random Intercept Model (RIM). Example Answer MLR RIM Question 2 Provide two conditions where random intercept model should be used. Example Answer Question 3 As a variable at the student level that is essential for explaining English score, we use the measure for IQ taken from…
-
Day 102
Hierarchical Linear Model Advance from Random Intercept Model (simple case of hierarchical linear model) by introducing random slopes. RIM handle group difference with respect to average value of independent variable. Yij = β0j + β1j Xij + Rij become… Yij = γ00 + U0j + γ10 xij + U1j xij + Rij , note this…
-
Day 101
Example Number of students is M = 3758Number of schools is N = 211Standard Deviation = 2.04 Using Y (Language Score) group by (School) Intraclass Correlation Coefficient (ρI) = 18.12/(18.12+62.85) = 0.22Standard Deviation of “Language Score” = √(18.12+62.85) = 9.00 Scale for effect that is independent of the measurement units = 2.04/9.0 = 0.57Each additional…
-
Day 100
Random Intercept Model aka Ordinary Least Square (OLS) model Some brief introduction, before start. Fixed Effect (Taken only 1 group, level 1) Exception, when all group sample size nj are equal to one. The researcher need to have no qualied about using the model because nesting structure are not take place in this situation. The…
-
Day 99 (2), 101 (2), 103
Question 1 Discuss the disadvantages of “aggregation” Example Answer When we are using aggregation, the detail about the data point or micro data is ignored in order to conclude the overall picture; which is the macro level. By reducing each aspect or characteristic, it may lead to misleading conclusion. For example, determine the performance of…
-
Day 99
Disaggregation Disaggregation lead to “miraculous multiplication of the number of units” Suppose we want to understand “do new judges tend to give more harsh or more lenient sentences”? However taking observation base on (44) trials instead of (6) judges to estimate the relation is wrong. Sample size is exaggerated. From the perspective of between group…
-
Day 98 (2)
Statistical Treatment of Clustered Data First step is to understand relationship between independent observation in a single classroom, or intraclass correlation. Second step is to perform aggregation to the observations such as simple statistics (mean, standard error of the mean, variance, correlation, reliability of aggregates). This is the treatment for two-stage sampling designs. Why this…
-
Day 98
Question 1 Discuss “dependence as a nuisance”. Example Answer Student motivation level depends on teacher experience. Hypothesis teacher perform well in the classroom, the teacher know how to tackle the student; it may increase student motivation level. So if to examine student motivation level in the classroom, i’ll pick up a classroom and sample randomly…
-
Day 97
Variable Proposition In this case, interested effect of teacher efficacy (Z) on pupil motivation (y) controlling pupil aptitude (x). ps. Put it this way, by constant the x, how Z would affect y? This could be linear correlated, as Z does not influence x to influence y. Looking into this, simple random sample must not…
-
Day 96
Data collected interpretation might have been wrong. One household is independent to other household; using simple random sampling. All single units in the population have the same chances of being selected into sample. The sampling was a two-stage one, and to pretend the secondary units were selected independently. Picking up household from the same housing…
-
Day 95
Question 1 Mixed effect model is a statistical method used in ANOVA and regression. Discuss the similarity between ANOVA and regression. Example Answer Both are similar statistical method use to analyst relationship between independent variable and dependent variable; taking account variation in data and explain the impact of the predictor. ANOVA focus on mean differences…
-
Day 94
Multilevel Analysis Word multi refer to many time aka stages. Multilevel analysis focus nested source and complex data. It has 2 components: Example School (look at classes(grade 1, grade 2, grade 3)) vs single class (look at pupils) [school funding, policies vs student performance] vs [teaching quality, classroom resources vs student performance] Firm (look at…
-
Multivariate Methods for Data Analysis
Day 68 Type of Multivariate Techniques Day 69 Statistical Significance and PowerPowerMultiple RegressionStep to form Regression Day 70 Tutorial Day 71 Factor Analysis Day 72 Tutorial Day 73 Cluster AnalysisK-means Cluster Day 74 Tutorial Day 75 Multiple Discriminant Analysis Day 76 Tutorial
-
Day 75
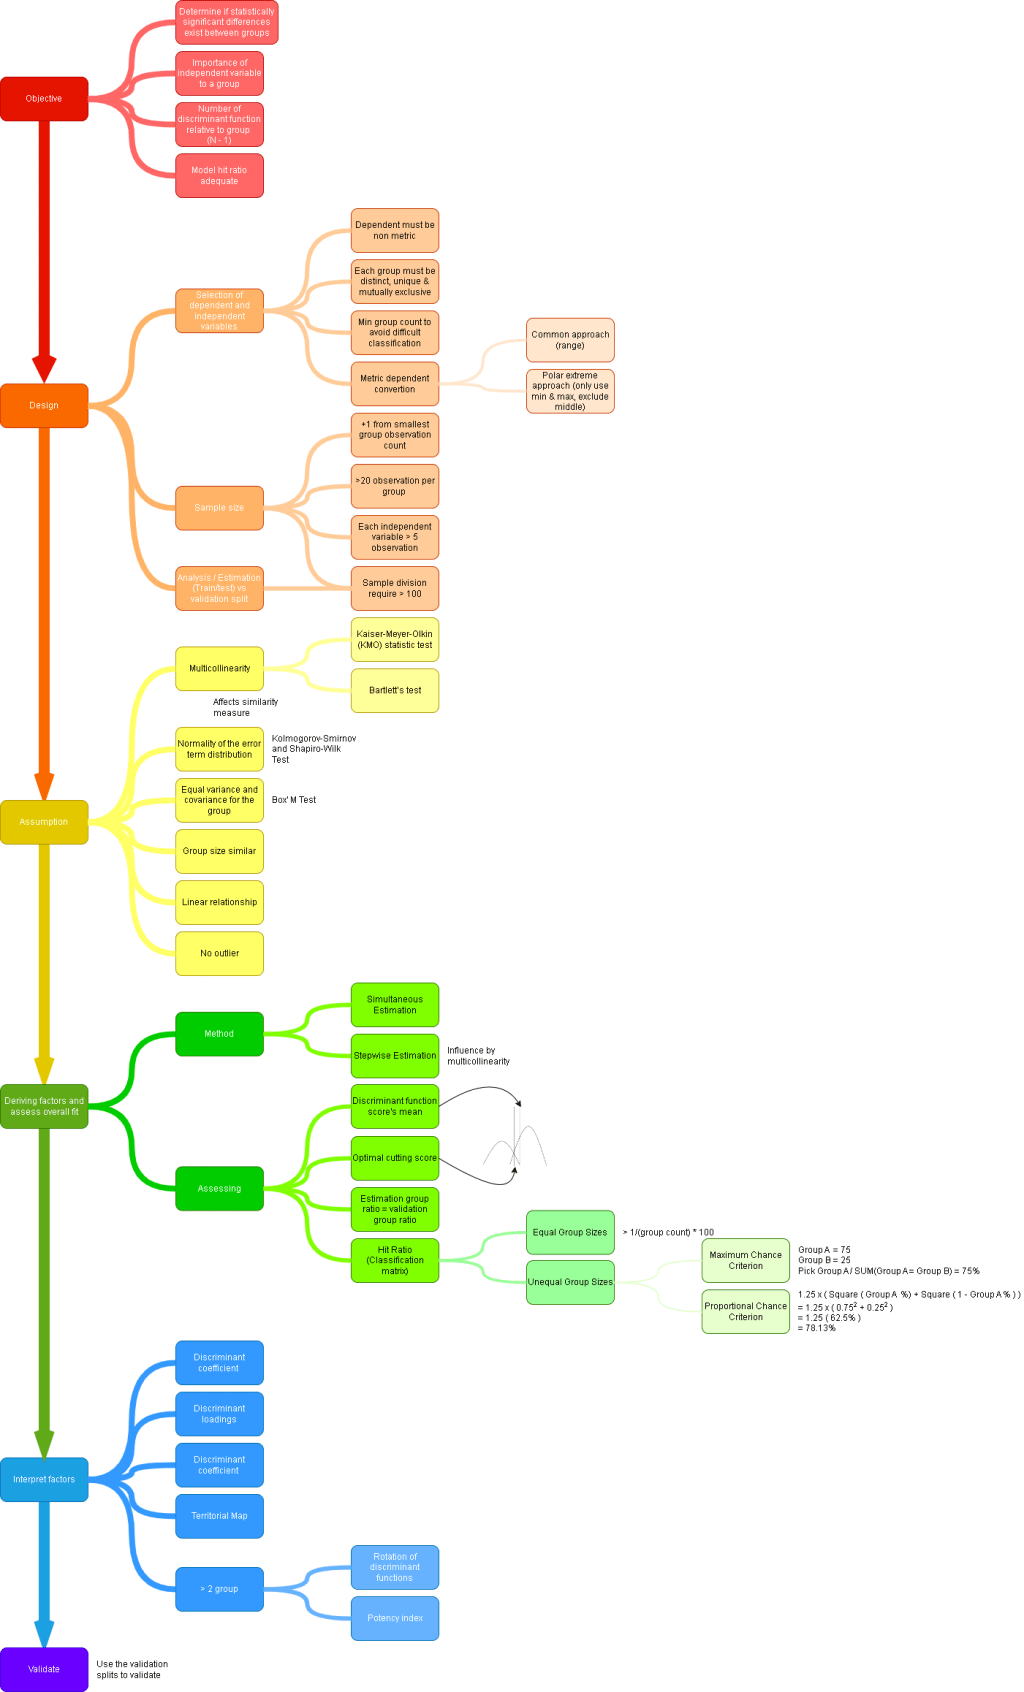
Multiple Discriminant Analysis ps. Classify observation into groups (non metric). SPSS Step 1. Normality of the independent variable distribution test result. Note that KS test is meant for n > 50 and SW test is meant for n < 50. Sig value > 0.05 means accept null hypothesis (variable are normally distributed). Step 2. Collinearity…
-
Day 73

Cluster Analysis ps. Group similar objects/observations based on the characteristic in a cluster that different to other object in other cluster. Also known as Q analysis or taxonomy. Hierarchical Cluster SPSS Step 1. Bring up Cluster analysis dialog box. Step 2. Configure all cluster setup. Step 3. Interpret agglomeration schedule and dendrogram. Look into Cluster…
-
Day 72
Tutorial 2 Question 1 Example Answer Exclude Q7 and Q8 Exclude Q6 as it is cross loading, show almost similar magnitude in factor 1 and factor 2. Factor 1 can be named as “Eating habits”.Factor 2 can be named as “Food preparation”.Surrogate variable = Q1 for factor 1, Q10 for factor 2.Summated scale f1 =…
-
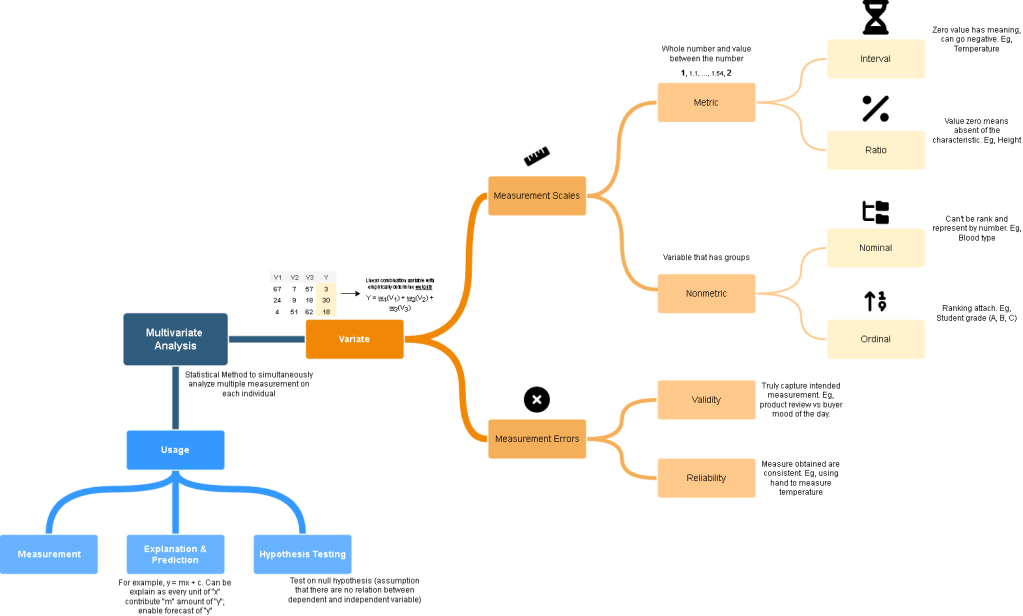
Day 71
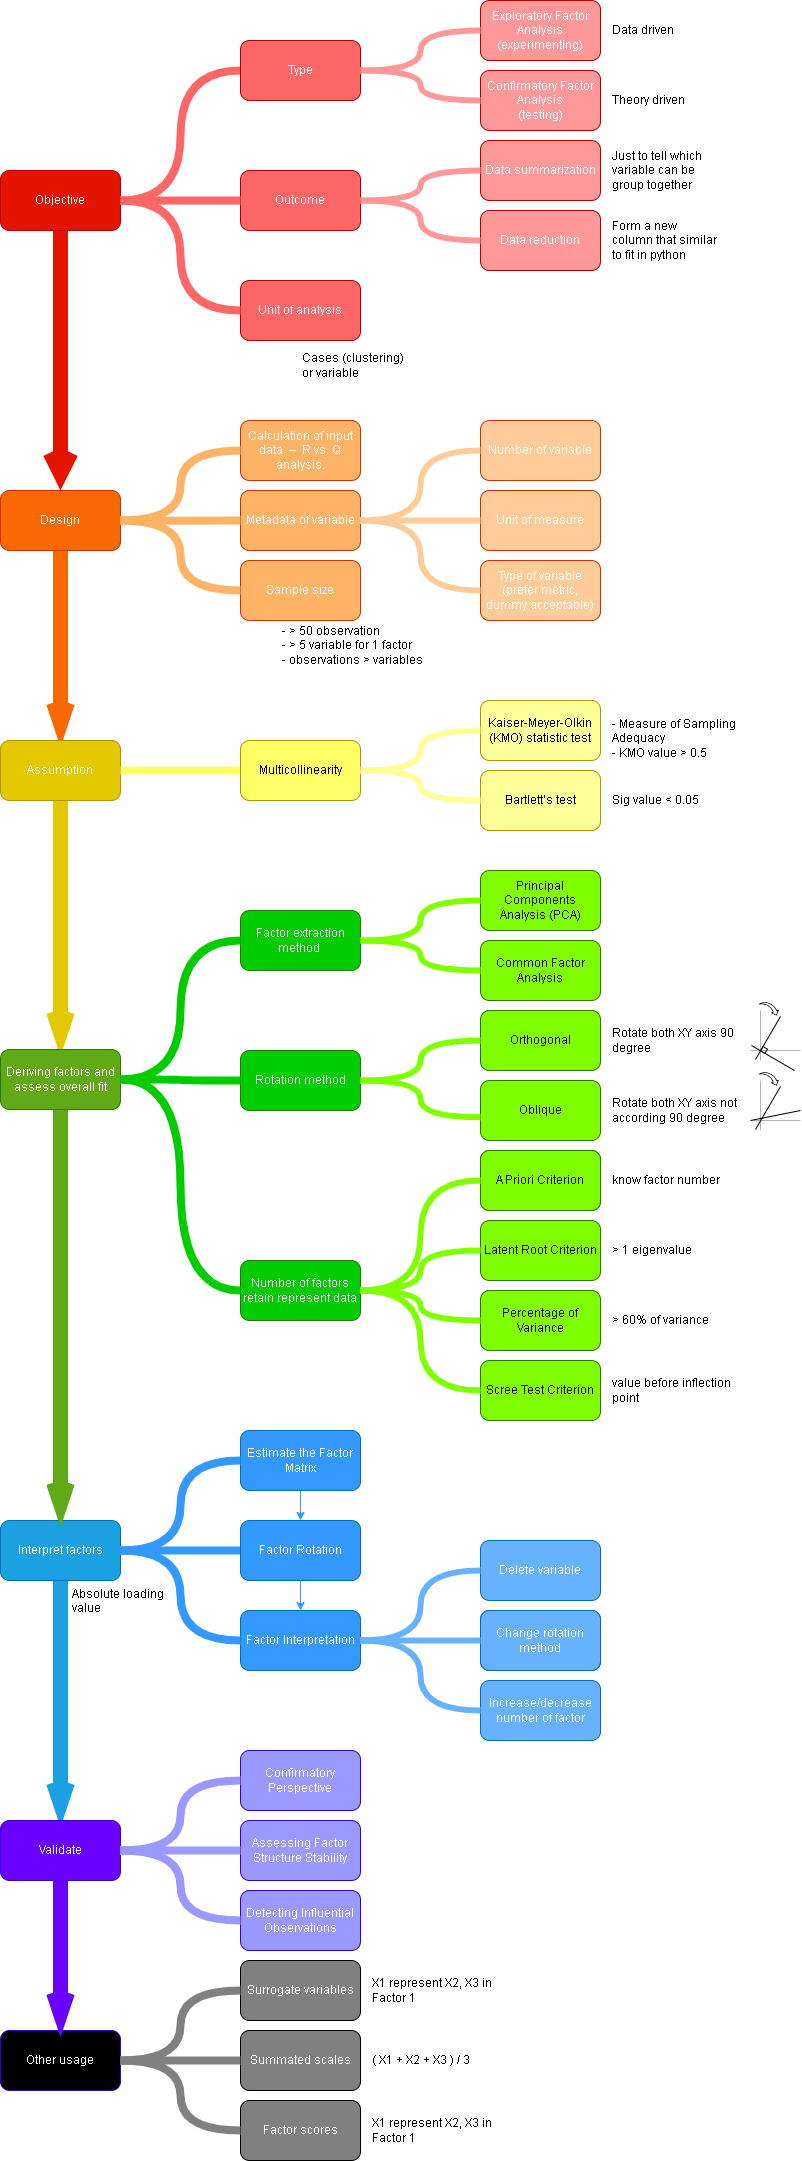
Factor Analysis ps. Not looking the effect of 1 variable to another variable. Only looking at how to group variable together that form a common characteristics. Underlying structure also known as factor. SPSS Step 1. Bring up Factor analysis dialog box. Step 2. Configure all factor setup. Step 3. Correlation test result. Relationship between 2…
-
Day 70
Tutorial 1 Question 1 Example Answer Question 2 Example Answer Exclude Pulse Exclude BSA By using stepwise method, independent variable are introduce/remove step by step while training the model.
-
Day 69
Statistical Significance and Power ps. This is to explain the consequences of making wrong judgement on statistical test. H0 is True H0 is False Accept H0 Type 2 Error Reject H0 Type 1 Error Power ExampleType I error (false positive) involves wrongly diagnosing a healthy person with a medical condition, risking unnecessary surgery. Type II…
-
Time Series Analysis and Forecasting
Day 55 Objective of time seriesTime Series Chart (Excel)Time Series Chart (R) Day 56 Time Series componentsStationary TestQualitative Model vs Quantitative ModelTutorial 1 Day 57 Smoothing Techniques Day 58 Smoothing Techniques (Con’t) Day 59 Tutorial 2 Day 60 Measuring Predictive Accuracy Day 61 Box Jenkins Methodology Day 62 Box Jenkins Methodology (Con’t) Day 63 Tutorial…
-
Day 65
Tutorial 5 Question 1 A volatile model is fitted to a stock return data and produce the following results (a) Write down the equation to forecast volatility based on the output above. (b) What can we conclude based on the results in ARCH LM-test? (c) Are all the coefficients in the model significant? Explain your…
-
Day 64
Volatile Model (ARCH & GARCH) Technique to address irregular fluctuation that cannot be handle by typical time series model such as ARIMA, Moving Average, Exponential Smoothing & others. R Import data. (download from https://finance.yahoo.com/quote/005930.KS/history) Check order of differencing. Result: Stationary check after differencing. Result: Check stationary and ARIMA hyperparameter. Result: Train an ARIMA model. Check…
-
Day 63
Tutorial 4 Question 1 The table below shows the result after fitting a time series data by an ARIMA model. (a) Write the ARIMA model equation based on the results above. (b) Represent the ARIMA model in ARIMA (p, d, q). (c) Is the ARIMA model adequate? Justify your answers. (d) Are all the AR…
-
Day 62
Box Jenkins Methodology (Recap) Split the below data into training (80%) and testing data (20%). Analyse the training data and formulate the model equation for the ARIMA model you chosen: Then, compute the accuracy of the model in the testing data. Check the residuals and test whether the model you chosen is satisfactory. Sales Import data. Split Train/Test. Check stationary and…
-
Day 61
Box Jenkins Methodology A step by step process to identify and fitting ARIMA model hyperparameter; as the model itself has 3 main component: In R, the model will be wrote as ARIMA (data, order=c(p aka [AR], d aka [I], q aka [MA])). ARIMA rely on stationary data; throw back to Day 56, there are 4…
-
Day 60
Measuring Predictive Accuracy Raw data (only for illustration) X Y Forecast Value 1 0.3324 1 2 2.9232 2 3 1.4348 3 4 4.0073 4 5 3.7612 5 6 5.1456 6 7 8.1008 7 8 8.3195 8 9 8.4495 9 10 10.9755 10 11 12.1784 11 12 13.6671 12 13 14.6767 13 14 17.7715 14 15…
-
Day 59
Recap. Differencing vs smoothing = differencing is about removing trend from time series, by “station” the data back to its mean; smoothing in the other hand focus on removing irregular signal to uncover pattern (trend & seasonality). Tutorial 2 Question 1 (a) Compute a three-quarter moving average forecast for quarters 4 through 13. (b) Compute…
-
Day 58
Smoothing Techniques (Con’t) Regression on seasonality and trend Linear Regression VS Trend Component Multi-Linear Regression VS / to handle Seasonality Component Using dummy encoding to handle season. 3 dummy to handle quarterly, 11 dummy to handle monthly. Excel 1. Raw Data; Predict Year 6. Season Year 1 Year 2 Year 3 Year 4 Year 5…
-
Day 57
Smoothing Techniques Techniques Focus on Moving Average Stationary / Irregular Component Weighted Moving Average Exponential Moving Average Modified Moving Average Exponential Smoothing Holts Method Trend Component Linear / Quadratic / Exponential Trend Decomposition Model Seasonal + Trend Component Holts Winter Smoothing Dummy variable + Regression ps. Most of the time series forecast technique are under…
-
Day 56
Time Series 4 Components that made up time series 1. Irregular fluctuations – Does not follow any available pattern and not predictable; normally short period. Eg. Rise in the steel due the strike in the factory. 2. Cyclical – Large sine wave cycle about 8-10 year. Exhibit 4 phases (Peak → Recession → Depression →…
-
Day 55
Objective of time series Time Series Chart Excel 1. Raw Data Year Quarter 1 Quarter 2 Quarter 3 Quarter 4 1 667 631 675 699 2 739 695 751 779 3 823 795 835 875 4 931 855 939 967 2. Copy & paste again but holding “Ctrl” button3. Click on “Transpose” button 4. Copy…
-
Advanced Business Analytics and Visualization
Day 42 Day 43 Day 44 Donut Chart Day 45 (1) , 45 (2) , 45 (3) , 45 (4) , 45 (5) Bump ChartWaterfall ChartPareto ChartLollipop ChartChart Parameter Day 46 Tableau Storyboard Day 47 Exploratory Data Analysis (EDA) Day 48 Decision Tree Day 49 Linear RegressionImputationTransformation Day 50 Neural network Day 51 High performance…
-
Day 47
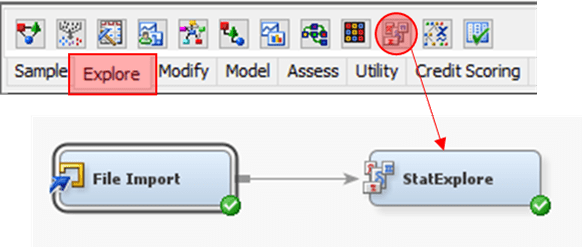
Exploratory Data Analysis (EDA) 1. Configure dataset Role accordingly 2. From Explore tab, drag StatExplore node3. Link nodes as shown4. Run StatExplore Result Tips Replace value in column using Replacement and Impute 1. From Modify tab, drag Replacement and Impute node2. Link nodes as shown 3. Configure Replacement node accordingly 4. in Replacement Editor for…
-
Day 45 (5)
Parameter 1. Click on “Age” to create Bins In Edit Bins [Age]2. Instead of fix size bin, select Create a New Parameter In Create Parameter3. Update the field accordingly 4. “Age (bin)” to Columns5. “Count” to Rows6. For parameter “Bin Size for Age” select Show Parameter7. At right side of pane, drag slider to modify…
-
Day 45 (4)
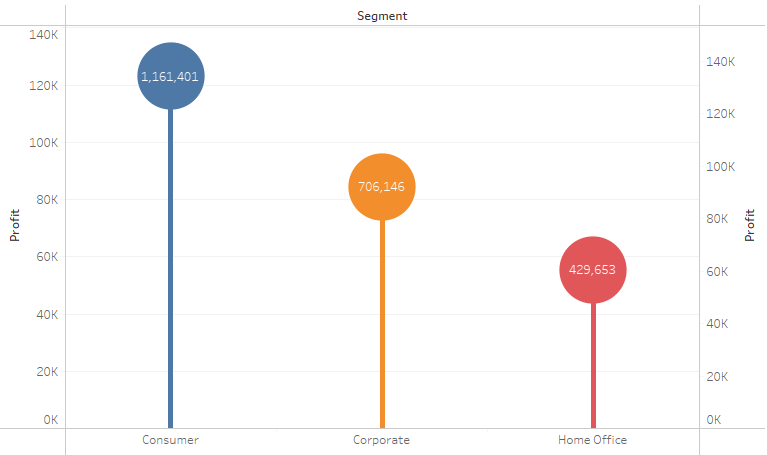
Lollipop Chart Tableau Note:– Overlay technique 1. “Segment” to Columns2. “Profit” to Rows3. “Segment” to Color 4. Do “Profit” again but this time Marks Circle 5. Combine 2 plot together using Dual Axis Spotfire Note:– In Combination Chart, no capability to set Color by attribute, only by series– no capability to create circle; hack using…
-
Day 45 (3)
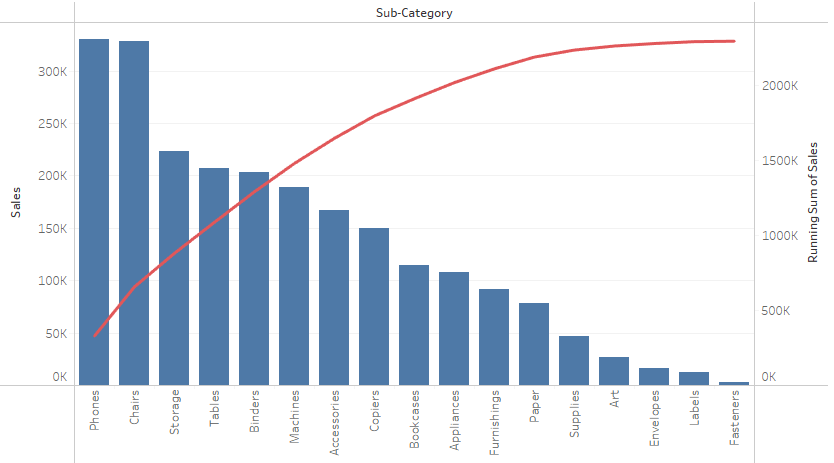
Pareto Chart Tableau Note:– Overlay technique 1. “Sub-Category” to Columns2. “Sales” to Rows 3. Click on “Sub-Category” and select Sort…4. In the Sort Menu, Change to Sort by Field, Sort Order Descending and Field Name is Sales. 5. Do “Sales” again but this time Marks Line 6. Combine 2 plot together using Dual Axis Spotfire…
-
Day 45 (2)

Waterfall Chart Tableau Note:– Uses starting position of Grantt Bar as anchor, negative value of size to expand the bar 1. “Order Date” to Columns2. “Sales” to Rows 3. Bar chart cannot be use as it always start from “0” aka bottom of chart4. Grantt Bar however started at the value itself, only missing link…
-
Day 45
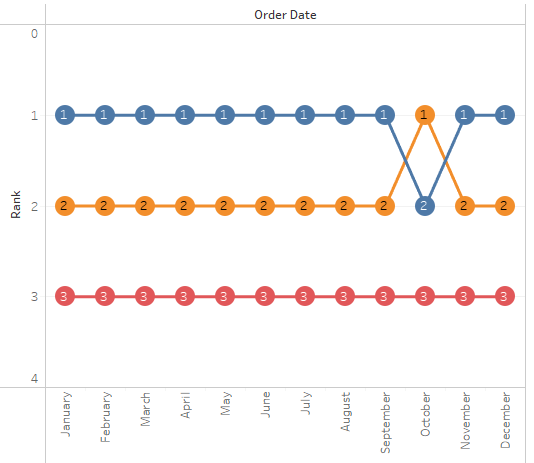
Bump Chart Tableau Note:– Overlay technique– Ranking and aggregation is calculated during plot initialization 1. “Order Date” to Columns2. “Sales” to Rows3. “Segment” to Color 4. Do “Sales” again but this time Marks Circle 5. Combine 2 plot together using Dual Axis Spotfire Note:– Can be done using line chart (w. Marker) or scatter plot…
-
Data Analytical Programming
Day 28 Day 29 Day 30 Day 31 Day 33 Day 34 Day 35 (1), 35 (2) Day 36 Day 37 Day 38
-
Day 24
Data Warehouse Online Analytical Processing (OLAP). Store structured data, data source from Online Transactional Processing (OLTP), live database. Storage repository; not storing live data, only store pass/historical data. Mostly used for model training, analysis and pattern discovery. Example, student data stored in database but graduated student data stored in data warehouse. Data Lake Store both…
-
Day 16, 28 (2), 29
What is dataset ? holding data about particular subject.row = observationcolumn = variable What is SAS? Statistical Analysis System. What is sas library? To store data permanently, maximum 8 character long. What is sas work? To store data temporary. Start programming 1. Create working folder. 2. Upload excel. 3. Create library. 4. Import excel to…
-
Day 15, 28 (1)
Get Started 1. Sign-up. https://www.sas.com/en_my/home.html 2. If not responding, look for SAS chatroom. https://www.sas.com/en_us/contact.html 3. Look for “Launch” icon. What is Dataset? Holding data about particular subject, a collection of data that is relate to a particular subject. What is Observation? Row in dataset. What is Variable? Column in dataset, maximum 32 character long. Must…
-
Day 12 (2)
Perks! Add “dplyr” package to enable following function select(variable_name, column_name) → similar like SQL select, can perform column alias, range column name, start/end with column name and exclude column. Result: filter(variable_name, condition) → single or multiple logical condition; similar to subset(). Result: mutate(variable_name, column_name) → create, edit or delete column (fill value with NULL). Result:…
-
Day 12 (1)
Tutorial 11 Question 1:Explain the cycle of big data management. Example Answer Big data management involves a series of processes aimed at handling large volumes of data effectively. The cycle of big data management typically involves the following stages:Capture: This is the process of collecting data from various sources, including social media platforms, IoT devices,…
-
Day 10 (2)
Data Structure (con’t) data.frame(data) → two dimension, multiple datatype Result: Add data rbind(variable_name, variable_name) Result: cbind(variable_name, variable_name) Result: Import data read.csv(file_path, header=TRUE/FALSE) Access column Result: Delete column Result: Data frame function nrow(variable_name) Result: 4 ncol(variable_name) Result: 3 dim(variable_name) Result: names(variable_name) Result: head(variable_name, quantity) Result: tail(variable_name, quantity) Result: list(data) → multi dimension, multiple datatype Result:
-
Day 10 (1)
Hive Engine translate HQL to Map Reduce. Data stored in table stored in HDFS as flat files. Data is not verify during insertion, example copy flat file into HDFS; update metadata in Hive Table (“msck repair table” command). Hive itself has specific folder and if data stored outside hive folder are known are external table.…
-
Day 9 (2)
Data Structure the way how to store data in memory. For example, store data in matrix form, 5row x 3column. factor(data,levels,labels) → single dimension, kinda like relational database dim::fact concept Result: so what happen here is that data is “a”, “a”, “b”, 1. But due to levels parameter, “1” is remove to end and all…
-
Day 8
Spark Cluster computing framework, processing framework using memory. To overcome map reduce performance issue. Cluster manager resource allocation base on job (request). Spark create Resilient Distributed Datasets (RDD) :: partition once it receive the data. Once RDD is ready, it uses graph transformation (Directed Acyclic Graph DAG) Consists of 2 phases: Transformation and Action **…
-
Day 7
Tutorial 6 HBase A distributed column-oriented data store built on top of HDFS. It is a part of Hadoop ecosystem that provides random real-time read/write to data in the Hadoop File System. HDFS (Write Once Read Many) HBase Not good for record lookup, only file lookup Fast record lookup Not good for incremental addition of…
-
Day 6
Map Reduce refer to– https://informationit27.medium.com/hadoop-mapreduce-in-action-b7c723b604ba– https://www.slideshare.net/mudassarmulla/tutorial-hadoop-hdfsmapreduce– https://cwiki.apache.org/confluence/display/HADOOP2/JobTracker– https://www.youtube.com/watch?v=ULtOZqlZnCw Tools built on top of Map Reduce Shortcoming of Map Reduce
-
Day 5 (2)
Condition ==,<,<=,>,>=,!= → boolean operators if/else Result: switch → if not integer/index, must define result. Result: out of condition return NULL Result: for Result: while Result: repeat Result:
-
Day 5 (1)
Tutorial 4 Tutorial 5 Discuss and evaluate suitable techniques/methods being used in literature while performing the big data analytics on the following:a) Market Basket Analysis.b) Customer Churn Prediction Analysis.Please support your discussion based on a research paper. Example AnswerThe big data analytics on Market Basket Analysis could help to· Provide combo offers based on products…
-
Day 4
5 Daemon “Daemon” that sound like demon, is the background service that not initiated by user. HDFS Map Reduce Hadoop is distributed storage and processing. It only means the data node (storage & processing), not for name node; Name node (master) must be high availability hardware (expensive); Secondary name node come in to make name…
-
Day 3
What is the benefit of distributed? Using parallel concept, original task might complete in 11 hour, but if parallel in 4 machine, it would took only 3 hour. Challenges Hadoop Core Principle Hadoop Components Why Hadoop? (feature) Hadoop Definition Hadoop is an open-source software framework (LICENSE) for distributed storage and distributed parallel processing (HOW) of…
-
Day 2 (2)
Concept and terminology What is dataset? Collection or groups of related data. Dataset is like when a new student join in, he/she share the same common attribute/properties like other. What is algorithm? Algorithm is a set of rule/step/instruction for problem solving, that later can be implement into program. Algo vs program – You can execute…
-
Day 2 (1)
UI in R Studio Code Code reusability, introduce “package”, which is a public directory from CRAN. also similar to Operation+,-,*,/,%% → Basic Maths operatorsfirst *, / later +, – → Operator Precedence=, ->, <-, assign → variable declarationsrm(<<variable name>>), remove(<<variable name>>) → remove a variableclass → to tell datatypes(numeric,integer,character,logical,date)is.<<datatype>>(<<variable name>>) → checking/testing/validation the data typeas.<<datatype>>(<<variable…
-
Day 1
What is data? Data is a series of measurement, series of observation, series of raw facts does not convey any meaning. Data is not equal to information. Information is generated when data is processed. Due to the exponential grow of data and several era of technological advancement. Huge electronic generation happens lead to huge deposit…