Tag: Chart
-
Day 45 (5)
Parameter 1. Click on “Age” to create Bins In Edit Bins [Age]2. Instead of fix size bin, select Create a New Parameter In Create Parameter3. Update the field accordingly 4. “Age (bin)” to Columns5. “Count” to Rows6. For parameter “Bin Size for Age” select Show Parameter7. At right side of pane, drag slider to modify…
-
Day 45 (4)
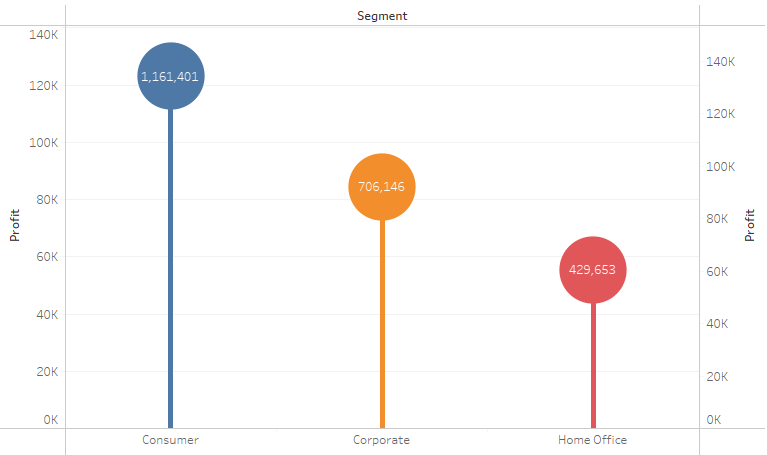
Lollipop Chart Tableau Note:– Overlay technique 1. “Segment” to Columns2. “Profit” to Rows3. “Segment” to Color 4. Do “Profit” again but this time Marks Circle 5. Combine 2 plot together using Dual Axis Spotfire Note:– In Combination Chart, no capability to set Color by attribute, only by series– no capability to create circle; hack using…
-
Day 45 (3)
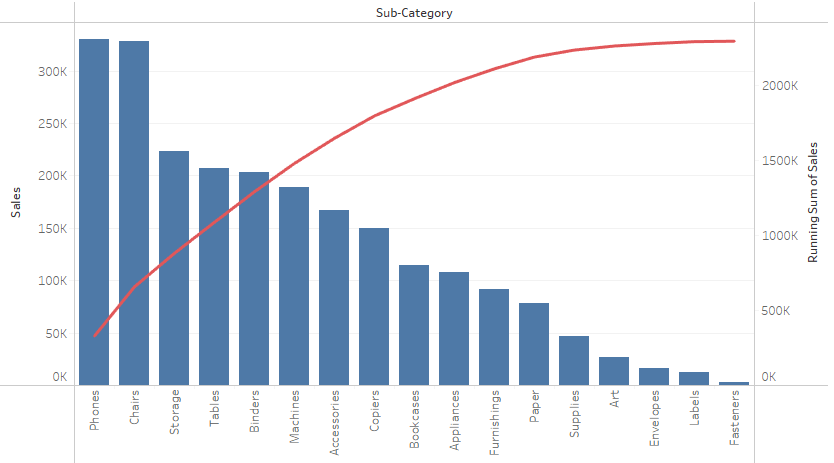
Pareto Chart Tableau Note:– Overlay technique 1. “Sub-Category” to Columns2. “Sales” to Rows 3. Click on “Sub-Category” and select Sort…4. In the Sort Menu, Change to Sort by Field, Sort Order Descending and Field Name is Sales. 5. Do “Sales” again but this time Marks Line 6. Combine 2 plot together using Dual Axis Spotfire…
-
Day 45 (2)

Waterfall Chart Tableau Note:– Uses starting position of Grantt Bar as anchor, negative value of size to expand the bar 1. “Order Date” to Columns2. “Sales” to Rows 3. Bar chart cannot be use as it always start from “0” aka bottom of chart4. Grantt Bar however started at the value itself, only missing link…
-
Day 45
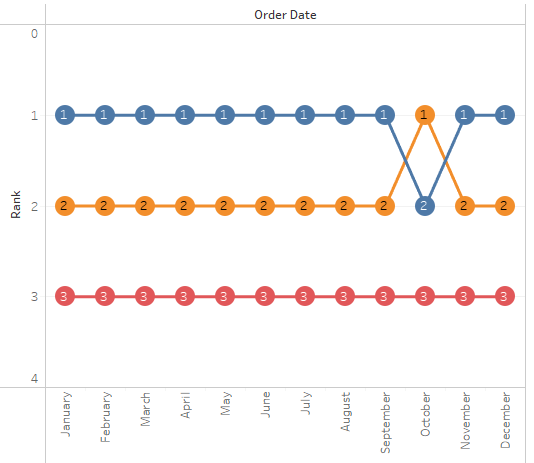
Bump Chart Tableau Note:– Overlay technique– Ranking and aggregation is calculated during plot initialization 1. “Order Date” to Columns2. “Sales” to Rows3. “Segment” to Color 4. Do “Sales” again but this time Marks Circle 5. Combine 2 plot together using Dual Axis Spotfire Note:– Can be done using line chart (w. Marker) or scatter plot…