Research breakdowns, practical implementation notes, and opinionated takes from real-world data and AI work.
-
Advanced Business Analytics and Visualization
Day 42 Day 43 Day 44 Donut Chart Day 45 (1) , 45 (2) , 45 (3) , 45 (4) , 45…
-
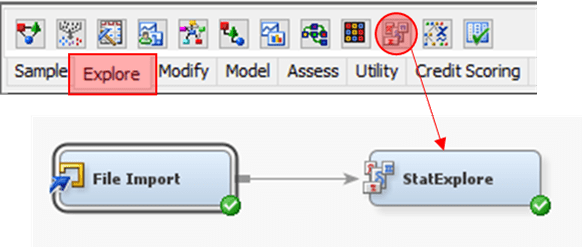
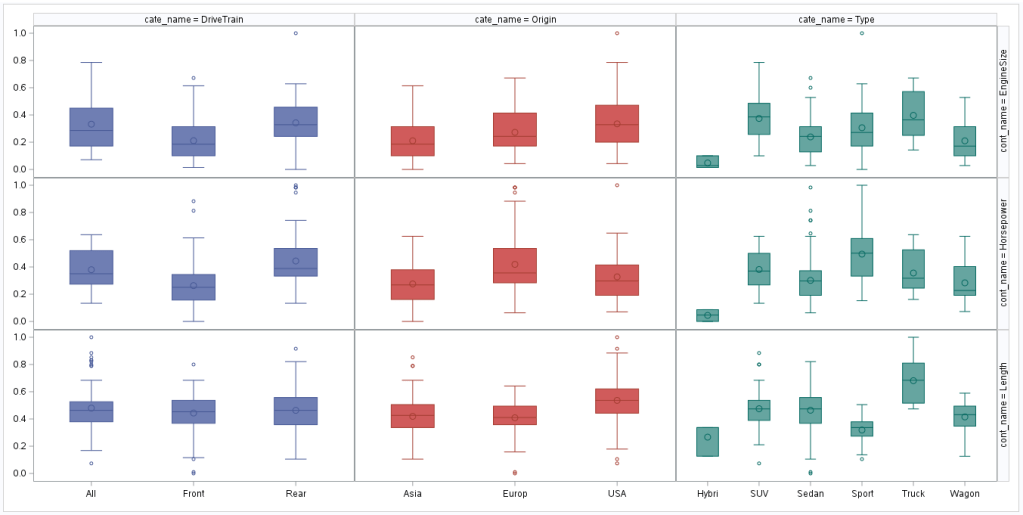
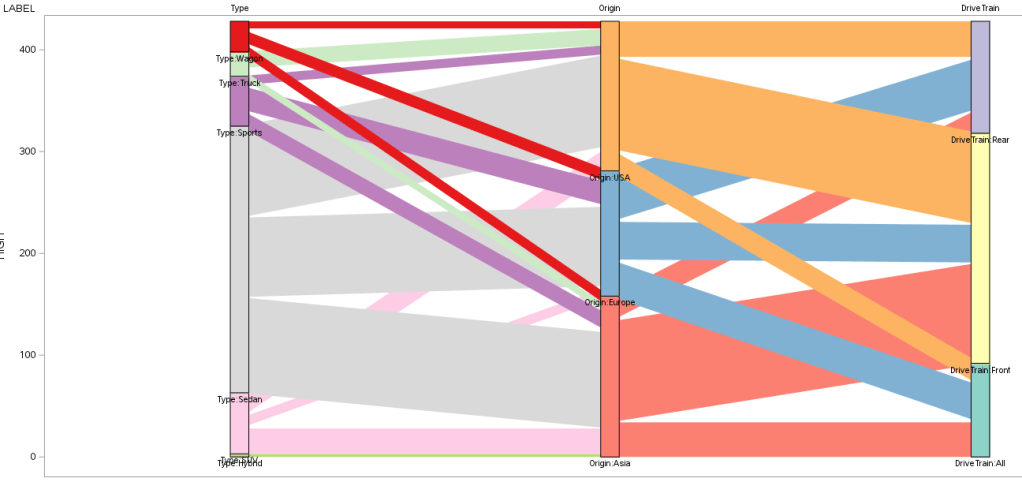
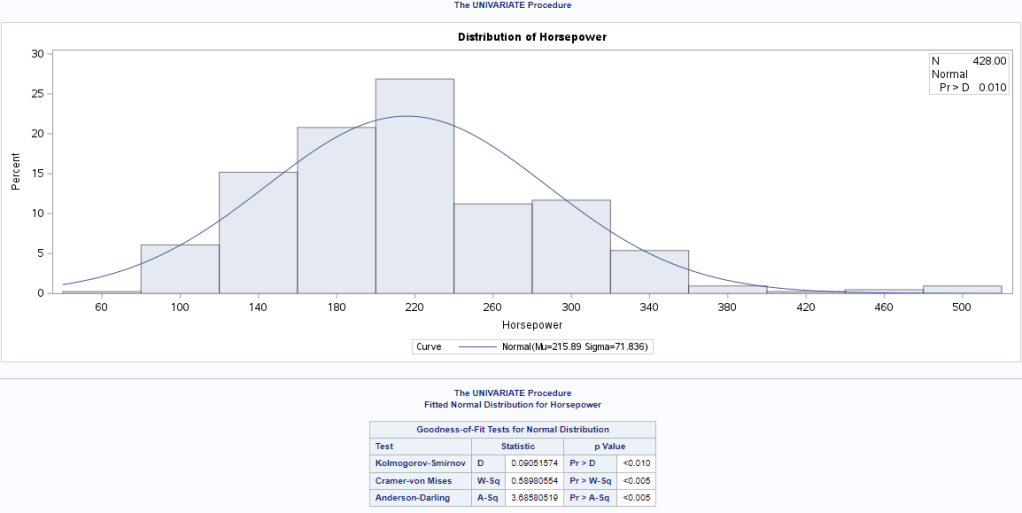
Day 47
Exploratory Data Analysis (EDA) 1. Configure dataset Role accordingly 2. From Explore tab, drag StatExplore node3. Link nodes as shown4. Run StatExplore…
-
Day 45 (5)
Parameter 1. Click on “Age” to create Bins In Edit Bins [Age]2. Instead of fix size bin, select Create a New Parameter…
-
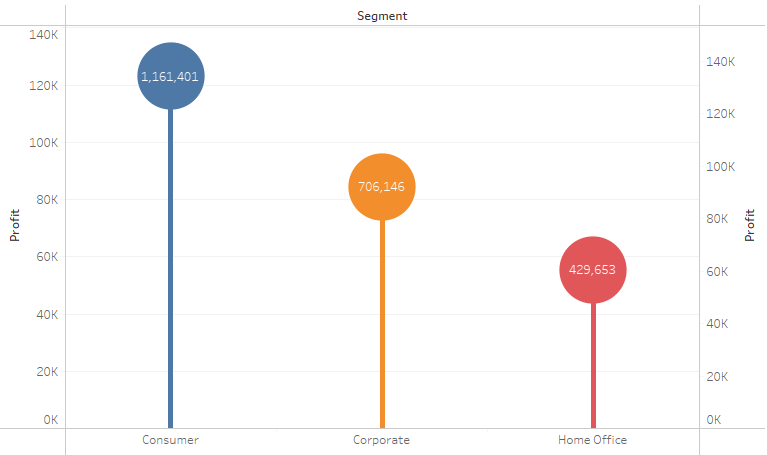
Day 45 (4)
Lollipop Chart Tableau Note:– Overlay technique 1. “Segment” to Columns2. “Profit” to Rows3. “Segment” to Color 4. Do “Profit” again but this…
-
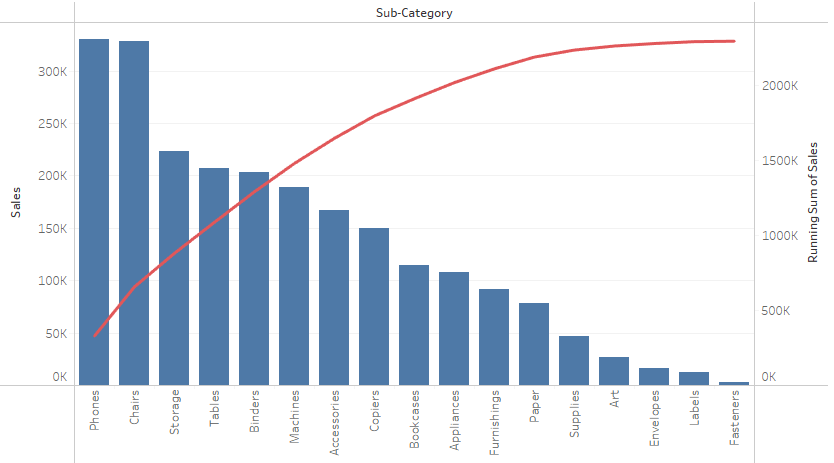
Day 45 (3)
Pareto Chart Tableau Note:– Overlay technique 1. “Sub-Category” to Columns2. “Sales” to Rows 3. Click on “Sub-Category” and select Sort…4. In the…
-

Day 45 (2)
Waterfall Chart Tableau Note:– Uses starting position of Grantt Bar as anchor, negative value of size to expand the bar 1. “Order…
-
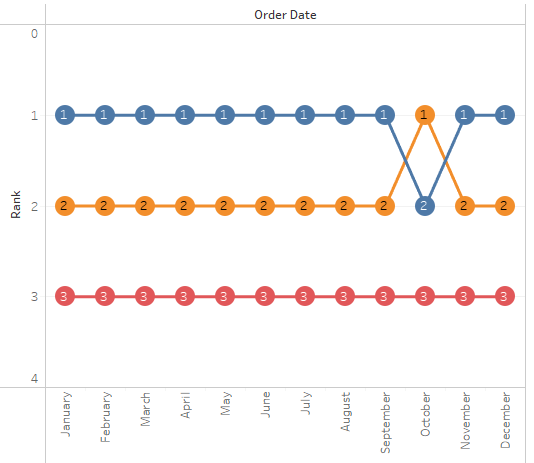
Day 45
Bump Chart Tableau Note:– Overlay technique– Ranking and aggregation is calculated during plot initialization 1. “Order Date” to Columns2. “Sales” to Rows3.…
-
Data Analytical Programming
Day 28 Day 29 Day 30 Day 31 Day 33 Day 34 Day 35 (1), 35 (2) Day 36 Day 37 Day…