
Research breakdowns, practical implementation notes, and opinionated takes from real-world data and AI work.
-
Finetuning LLMs for Automatic Form Interaction on Web-Browser in Selenium Testing Framework
ref: https://arxiv.org/pdf/2511.15168 Summary Trained a new LLM to understand web form (HTML code) and generate reliable Selenium script for webpage testing. Differ to…
-
The Iceberg Index: Measuring Skills-centered Exposure in the AI Economy
ref: https://arxiv.org/pdf/2510.25137 Summary Performed a workforce “digital twin” simulation on human capabilities overlap with AI. Existing workforce metrics does not work on…
-
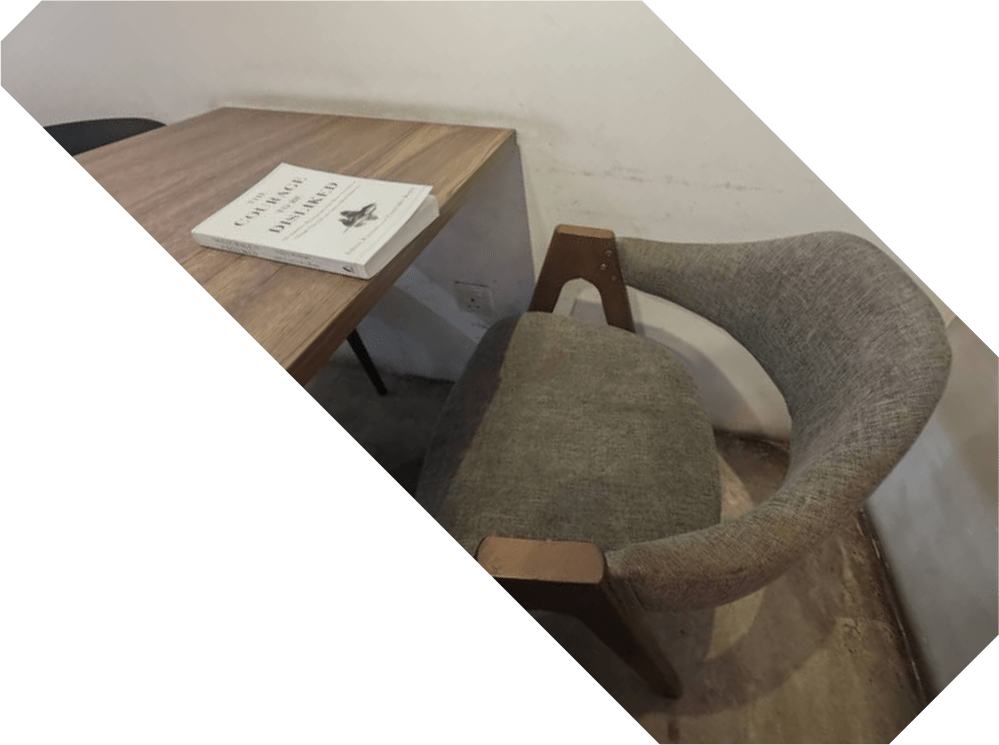
The courage to be disliked
The book placed a mirror in front of me, I saw not who I was, but how I had been living. Etiology…
-

Dirtiest Business Trick
How to start the right business — even if you have no idea what to do. Zhang had a shoplot but no…
-

Sell me this pen
Link: Instagram Round 1 Customer: Ok, i wanna try something, sell me this pen.Salesman: Sir, this is a marker. (Created a tailwind)…
-

Predicting 100% in IRIS dataset
dataset: https://archive.ics.uci.edu/dataset/53/iris While scrolling through YouTube, I came across this video:https://www.youtube.com/watch?v=MdOCu2Gr-0g It explores Fibonacci numbers, which sparked a thought—could I experiment with…
-
GDG DevFest KL 2024
When: Sat 2024-12-07 9am – 6pm (MYT)Where: Level 2, Menara Ken TTDI, 37, Jalan Burhanuddin Helmi, Taman Tun Dr Ismail, 60000 Kuala…
-
AI Tinkerers Kuala Lumpur #6
When: Mon 2024-11-28 6pm – 9pm (MYT)Where: Level 8, Menara Southpoint @ Mid Valley City, Medan Syed Putra Selatan, 59200 Kuala Lumpur…
-

Quiz
Saw a challenge in LinkedIn about creating a tree and here is my try =P resolution from the internet.
-
Multilevel Data Analysis
Day 94 Multilevel AnalysisContextual AnalysisMixed Effects Models Day 95 Tutorial Day 96 Data collected wronglyType of mistake occur Day 97 Variable Proposition…
-
Day 106
Question 1 As a variable at the student level that is essential for explaining Economics score, we use the measure for revision…
-
Day 105 (2)
Hypothesis Test t-test = sample size < 30, t distributionz-test = sample size > 30, z distribution For multi-level regression, t-test is…
