
Question 1
As a variable at the student level that is essential for explaining Economics score, we use the measure for revision hours per month taken from a study. The revision hours has been centered, so that its mean is 0. The results are presented below.

Revision hours here is the variable with overall centering but no group centering.
Construct the confidence interval for the standard deviations and variance and
interpret the results.
Example Answer
Confident Interval for the level-one variance (σ2)
CI for σ2 = 44.23 ± 1.96 (0.86) = 44.23 ± 1.6856 = [42.54, 45.92]
The standard deviation is calculated as the square root of the variance
CI for r = √[42.54, 45.92] = [6.52, 6.78]
The estimated variance within group is 44.23 with 95% CI of [42.54, 45.92]. And the standard deviation is fall between 6.52 and 6.78, which representing the variability in economics score of the individual level.
Confident Interval for the level-two variance (r2)
CI for r2 = 9.27 ± 1.96 (1.36) = 9.27 ± 2.6656 = [6.60, 11.93]
The standard deviation is calculated as the square root of the variance
CI for r = √[6.60, 11.93] = [2.57, 3.45]
The estimated variance between group i s9.27, with 95% CI of [6.60, 11.93]. And the standard deviation is between 2.57 and 3.45. This show that the variability in the economics score across different groups.
Question 2
To study the effect of productivity (PDT) on total income (INC) of employees, a
researcher surveyed 80 listed companies in Malaysia and 15 employees chosen from the selected 80 listed companies. Seniority (SRT) is considered to be the important control variable in this study. Two random slope models are estimated and presented in the table in next page. The first model contains the raw (grand-mean-centered) PDT variable along with the group mean, the second contains the within-group deviation variable, ![]()

You are required to:
- test whether between-group and within-group regression of PDT on INC are different from one another, after controlling for the seniority.
- test whether the within-group regression is zero.
- test whether the between-group regression is zero.
Example Answer
1.
H0 = Y10 = Y20
H1 = Y10 ≠ Y20
H0 : there is no different between, between group and within group regression slope.
H1 : there is different between the slope
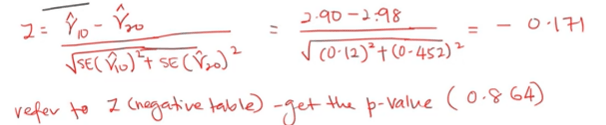
We fail to reject H0, the p-value 0.864 is more than 0.05. We can conclude that there is no statistically significant difference between the between-group and within-group regression slope of PDT on INC after controlling for seniority.
2.
H0 : the within-group regression of PDT on IV is zero
H1 : the within-group regression of PDT on IV is not zero

Since the p-value 0.0001 which is very small, we reject H0 the within group regression of PDT on INV is statistically different from zero.
3.
H0 : the between-group regression of PDT on IV is zero
H1 : the between-group regression of PDT on IV is not zero

Since the p-value are very small in both models (close to zero), so we reject the H0 and conclude that between group regression of PDT on INC is statically different from zero in both model.

Leave a comment