
Question 1
Compare the Multiple Linear Regression (MLR) and Random Intercept Model (RIM).
Example Answer
MLR
- Fixed effect model where all the variable are examine and tested having same impact across entire dataset.
- assume errors are independently and identically distributed, there are no correlation between the observation.
- is suitable when data is homogeneous or when grouping is not consider.
- less flexible for complex hierarchical or clustered data structure.
- apply intercept and slope to entire population.
RIM
- Take account on Mixed effect, where intercept are varies across group.
- allow correlation between observation within group, assuming the group has its own intercept but slope remain constant.
- is suitable when group level effect is accounted, such as repeated measure or hierarchical data.
- more flexible and accommodates both within group and between group.
- intercept different by group, group specific estimate.
Question 2
Provide two conditions where random intercept model should be used.
Example Answer
- Hierarchical Data
- when the data is group/clustered.
- Eg. Students within school, patients within hospital.
- Repeated Measures Data
- applies to same individuals, measured multiple time
- Eg. Trial measuring patients, blood pressure over several month (each patient is observed multiple time).
- this allows the patient have unique baseline blood pressure according for individual differences while analyzing the effect of time/medication on blood pressure change.
Question 3
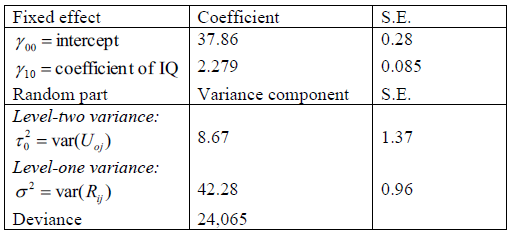
As a variable at the student level that is essential for explaining English score, we use the measure for IQ taken from a study. The IQ score has been centered, so that its mean is 0. Its standard deviation in this data set is 2.84. This is calculated as a descriptive statistic, without taking the grouping into account. Given that also the standard deviation of English score is 8.56. The results are presented in the table
below:
- write down the general regression equation.
- estimate an equation for a school with a typical low average achievement (bottom 2.5%).
- estimate an equation for a school with a typical high average achievement (top 2.5%).
- compute the standardized coefficient and interpret its meaning. 0.7561
- estimate the residual intraclass correlation and interpret its meaning.
- test whether the coefficient of IQ were 0.
Example Answer
a.

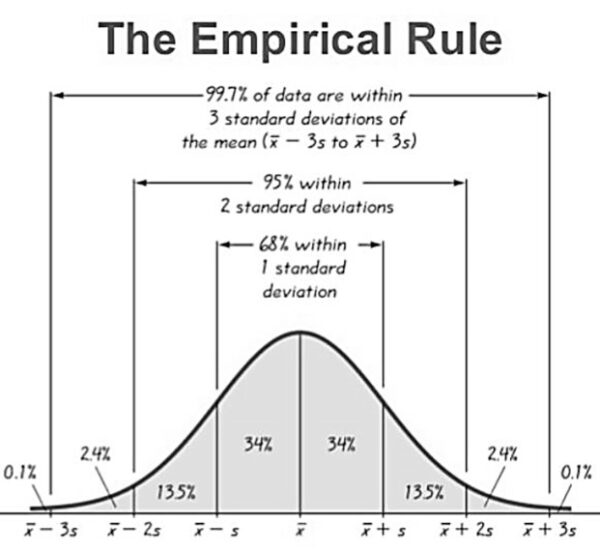
b. 2.5% means 2 standard deviation, because (100% – 95%)/2.
Level-two variance (8.67) need to be square root (√) and multiple to two standard deviation (2)
Lastly the value sum with intercept (37.86).

c.

d.

A standardized coefficient of 0.7561 means that for every one standard deviation increase in the IQ score, the English Score increase by approximately 0.7561 standard deviation. In other words, 75.61 of the total variation in English Score can be explain by the IQ score.
e.

The ICC of 0.1702 means that 17.02% of total variation in English Score can be attributed to differences between schools while remaining variation is due to differences between students within school.
f.
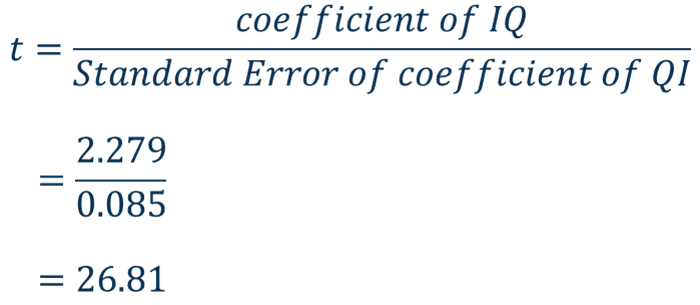
This t-value is extremely large, shows that the coefficient of IQ is highly significant. Therefore IQ has a statically significant effect on English Score.
Question 4
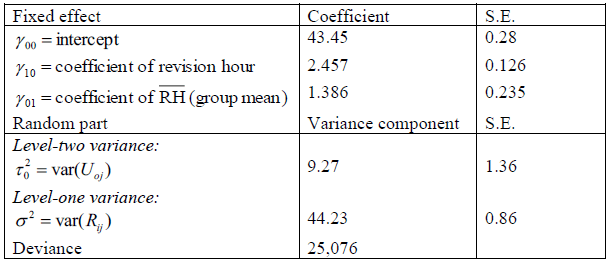
As a variable at the student level that is essential for explaining Economics score, we use the measure for revision hours per month taken from a study. The revision hours
has been centered, so that its mean is 0. The standard deviation for revision hours and economics score are 1.67 and 8.89 respectively. The results are presented below.
- write down the general regression equation.
- estimate an equation for a school with a typical low average achievement (bottom 2.5%).
- estimate an equation for a school with a typical high average achievement (top 2.5%).
- compute the standardised coefficient and interpret its meaning.
- estimate the residual intraclass correlation and interpret its meaning.
- test whether the coefficient of average revision hours were 0.
Example Answer
a.
Y = 43.45 + 2.457RH
b.
Y = 37.3607 + 2.457RH
c.
Y = 49.539 + 2.457RH
d.
SD of RH / SD of ES x Coefficient RH
= 1.67 / 8.89 x 2.457
= 0.461
e.
9.27 / (9.27 + 44.23) = 0.173
f.
2.457 / 0.126 = 19.49

Leave a comment