
Example
Number of students is M = 3758
Number of schools is N = 211
Standard Deviation = 2.04
Using Y (Language Score) group by (School)

Intraclass Correlation Coefficient (ρI) = 18.12/(18.12+62.85) = 0.22
Standard Deviation of “Language Score” = √(18.12+62.85) = 9.00
Scale for effect that is independent of the measurement units = 2.04/9.0 = 0.57
Each additional standard deviation on IQ leads, on average, to an increase in language score 0.57 standard deviations.
Using X (IQ) and Y (Language Score) group by (School)
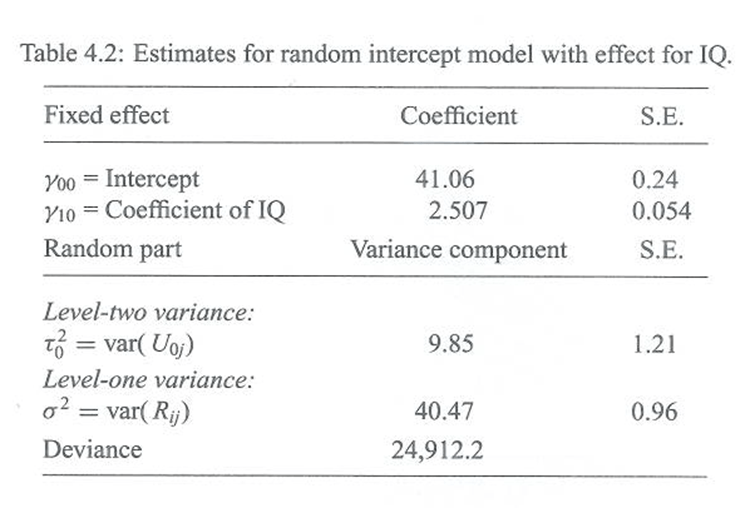
Regression Line given by Y = 41.06 + Uoj + 2.507 IQ
Residual Intraclass Correlation Coefficient = 9.85/(9.85+40.47) = 0.2
Standard Deviation of “Language Score” = √9.85 = 3.14
Standard Deviation of within group “Language Score” = √40.47 = 6.36
Bottom 2.5% or approximately 2σ (Lower Control Limit) Regression Line given by Y = 41.06 – 2 x √9.85 + 2.507 IQ = 34.78 + 2.507 IQ
Top 2.5% or approximately 2σ (Upper Control Limit) Regression Line given by Y = 41.06 + 2 x √9.85 + 2.507 IQ = 47.34 + 2.507 IQ
Each additional measurement unit of IQ leads, on average, to 2.507 additional measurement units of the language score.
Using X (IQ & IQ Group Mean?) and Y (Language Score) group by (School)

Regression Line given by Y = 41.11 + Uoj + 2.454 IQ + 1.312 IQ (Mean)
Within-group Regression Coefficient = 2.454
Between-group Regression Coefficient = 2.454 + 1.312 = 3.766
Standard Deviation of between class dependent “Language Score” = √8.68 = 2.95
Standard Deviation of within class “Language Score” = √40.43 = 6.36
t-ratio = 1.312/0.262 = 5.01
5.01 != 0, within and between group regression coefficient are indeed different

Leave a comment