
Disaggregation
Disaggregation lead to “miraculous multiplication of the number of units”

Suppose we want to understand “do new judges tend to give more harsh or more lenient sentences”? However taking observation base on (44) trials instead of (6) judges to estimate the relation is wrong. Sample size is exaggerated.
From the perspective of between group differences, this is Type 1 error (there is different but actually no difference between new/experience judge).
From the perspective of within group differences, this could result significant/no significant as the conclusion are drawn from 1 judges (say 4 trials all are lenient). Type 1 error of p-value is low due to small sample size.
Also leading to ecological fallacy, concluding something about the relations between micro level data at aggregate level
or
concluding relations between macro level data at disaggregated level.
Standard error of mean
https://blogs.sas.com/content/iml/2019/10/09/statistic-error-bars-mean.html
SEM equals SD / sqrt(N)
How to avoid? Using two-stage sample.
Eg. Randomly select 100 doctors, from the doctor, random select 5 patients.
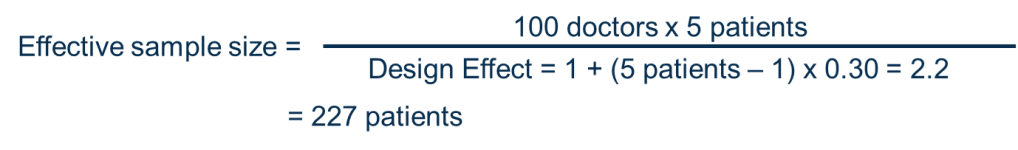
So what is “0.30” aka “p1 value”? it is the intra class correlation coefficient, which measure the similarity of observation count within the cluster.
- measure the degree of homogeneity within the cluster
Higher “p1 value”, units within the same cluster are more similar to each other; increase the design effect.
Higher “5 patient” aka “cluster size”, increase design effect because more similar unit are being sample within each cluster.
Conclusion, two stage sample of 500 patients is equivalent to simple random sample of 227 patients.
Looking for correlation
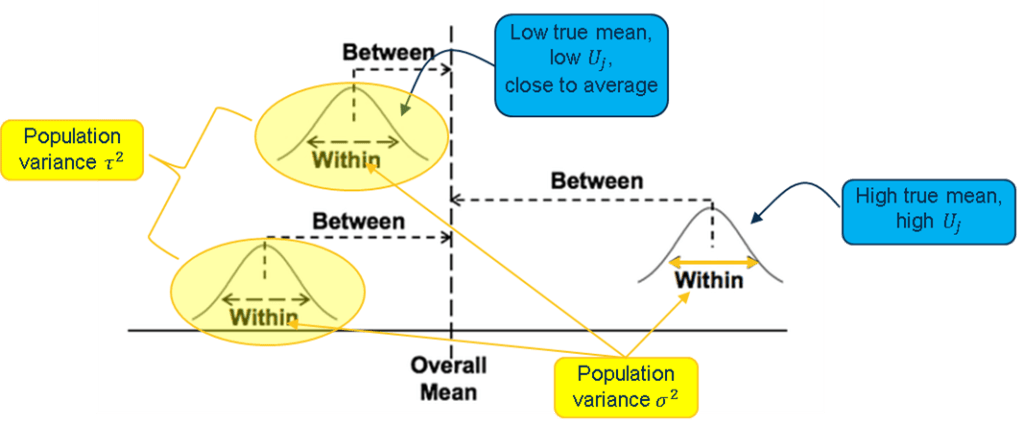
Empty Model aka random effect ANOVA aka one-way ANOVA
Yij = μ + Uj + Rij
μ is population grand mean.
Uj is specific effect on macro-unit “j”, Due to this variable is random, also know as random effect model.
Rij is residual effect for micro-unit “i” within macro-unit “j”.
Example,
source. https://www.statisticsfromatoz.com/blog/statistics-tip-of-the-week-sum-of-squares-between-ssb
Random Effect is where observations are nested within different group, the group effect are treated as random effect. Eg. different value represent different group having different shape of histogram.
Fixed Effect is variable within a group. Every observation in the group are “constraint” in the fixed range.
Correlation Analysis (Intraclass Correlation-ICC)
The degree of resemblance (similarity) between micro-units belonging to the same macro-unit
Intraclass Correlation Coefficient (ρI)

Also called a correlation coefficient because it is equal to the correlation between values of two randomly drawn micro-units in the same, randomly drawn, macro-unit.
If ρI of 0.3, it would mean that only 30% of the total variance in the outcome due to differences between group; while the remaining 70% is due to individual differences within the groups.
If pl of 0, it would mean that there are no group differences, or the true between-group variance is 0 (0% of the total variance in the outcome due to differences between group).
F-test

Answering the question.
- observed total variance is known to be 814.0
- observed between variance is given by 105.7
- estimated true variance within the macro-units is

- estimated intraclass correlation coefficient
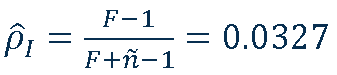
- F distribution with N-1 and M–N degrees of freedom if the null hypothesis holds

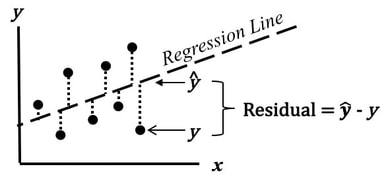
Linear Regression
Y = β0 + β1 X + R
β0 is called the intercept.
β1 is called the regression coefficient.
R is the residual or error component, and expresses the part of the dependent variable Y that cannot be approximated by a linear function of Y.
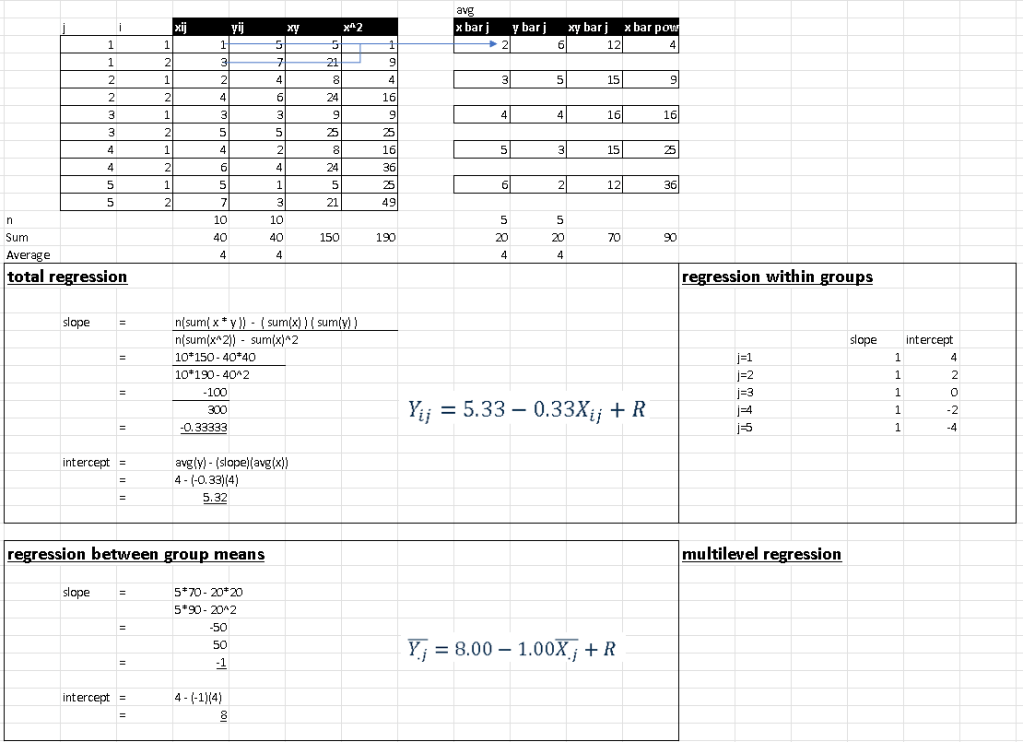
Example,
Total Regression, Regression between group means, Regression within groups, Multilevel Regression
So, what is the different between ANOVA and Linear Regression?
| ANOVA | Linear Regression |
|---|---|
| Testify mean differences | Testify relationship between x and y |
| Macro-micro level | Micro level |
| x is categorical, y is numerical | x and y is numerical |
 |  |

Leave a comment