
Statistical Treatment of Clustered Data
First step is to understand relationship between independent observation in a single classroom, or intraclass correlation.
Second step is to perform aggregation to the observations such as simple statistics (mean, standard error of the mean, variance, correlation, reliability of aggregates). This is the treatment for two-stage sampling designs.
Why this is important?
1. Avoid Ecological Fallacies 生态谬误
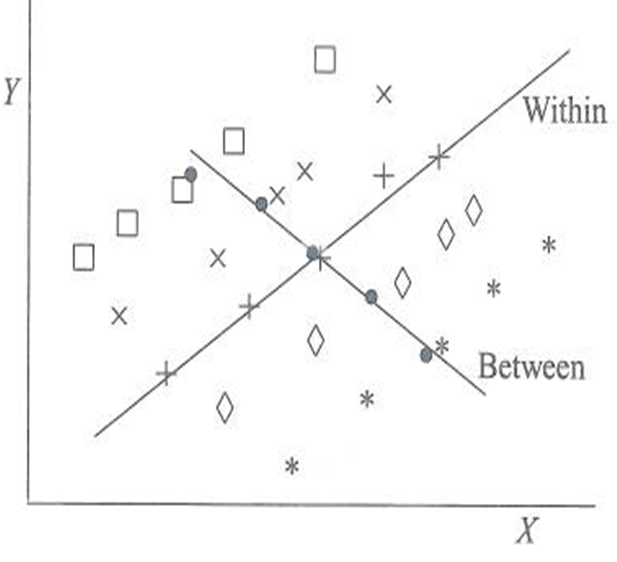
This occur when conclusions about individual data/behavior one drawn from group level data. Can be explained using regression.
| Individual | Group |
|---|---|
| Level 1 | Level 2 |
| Micro | Macro |
| Within Group Regression – Understand how variables interact within a single group or class. – Eg. Examining the correlation between study time and test scores within a single classroom. | Between Group Regression – Compare how variables differ or relate between different groups or classes. – Eg. Comparing the average test scores between different classrooms. |
 |  |
| Same classroom | Classroom 1 & 2 |
2. Group level mask individual level variations
Testing group effect, using individual granularity
3. Misinterpret group data lead to incorrect assumptions about individual behavior. Eg.
Group A score: 52, 54, 53, 51, 99, mean = 61.8
Group B score: 30, 61, 63, 65, 66, mean = 57
Group A score is 61.8, Group B score is 57. Wrong. 99 and 30 are being ignored; Individual effect are being ignore.
Method
- Aggregation
- Disaggregation
Aggregation
Common procedure is to aggregate micro level data to macro level data to perform two-level data analysis.
However, it would cause “shift of meaning” (Firebaugh, 1978; Huttner, 1981). Eg. Employee satisfaction to company performance. Aggregate all employee regardless department to single value and correlate to company performance. This is because production employee would weight more than helpdesk employee.
Second potential error is ecological fallacy. Eg. Percentage of black inhabitants could related to average political view in the neighborhood. ps. This is done at macro level. Now use the percentage as race to relate with political analysis, Wrong.
Third potential error is neglect original data structure.
Micro Level
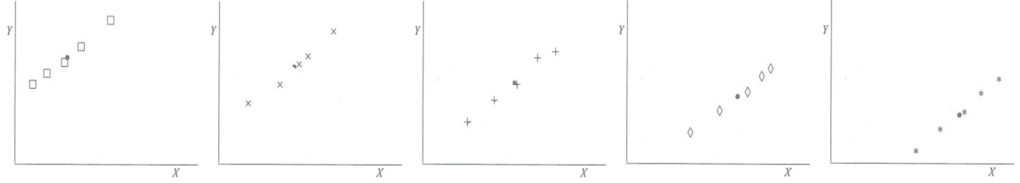
Macro Level
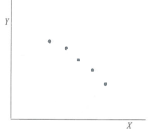
if we aggregate into single value per group, it is negative slope, the “•” are almost ontop of regression line.
This would lead us to draw wrong conclusion that there are no group differences.
Last potential error is prevent potential cross-level interaction effects of a specified micro-level variable with an as yet unspecified macro-level variable. Eg. Whether the sentence differential between black and white suspects is different between judges, when allowance is made for differences in seriousness of crimes.

Leave a comment