

Cluster Analysis
ps. Group similar objects/observations based on the characteristic in a cluster that different to other object in other cluster. Also known as Q analysis or taxonomy.
Hierarchical Cluster
SPSS
Step 1. Bring up Cluster analysis dialog box.
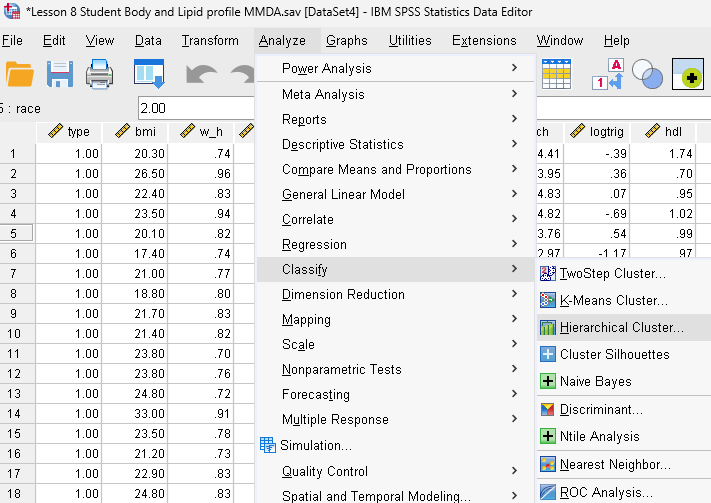
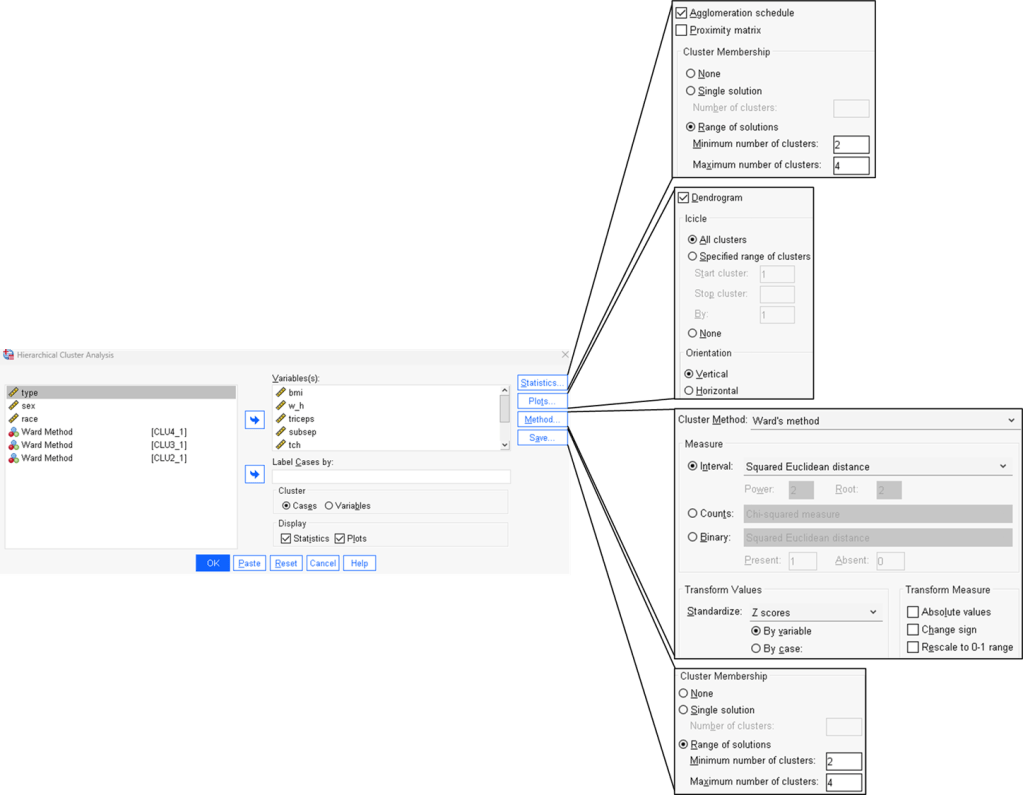
Step 2. Configure all cluster setup.
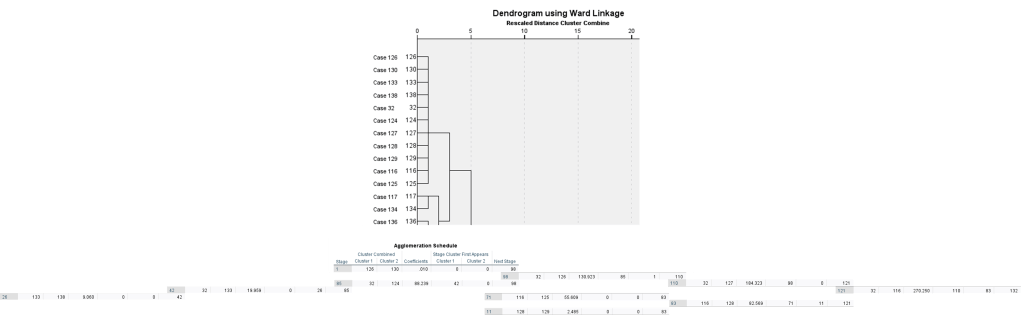
Step 3. Interpret agglomeration schedule and dendrogram.
Look into Cluster 1 and Cluster 2 as observation index number.
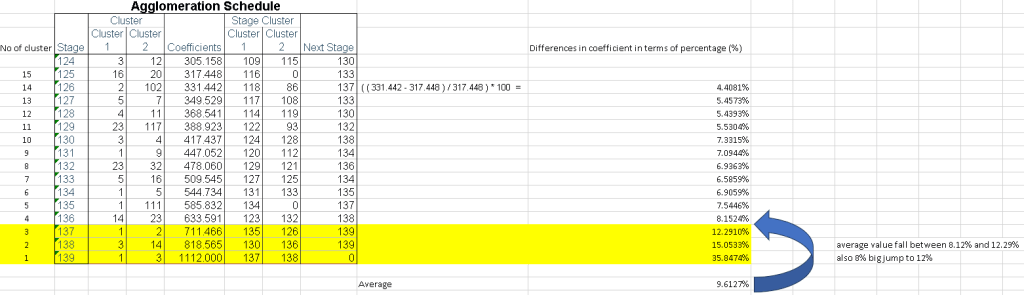
Step 4. Identify cluster to retain.
3 Cluster to be retain.
Step 5. CLU3_1 will be the clustering column.
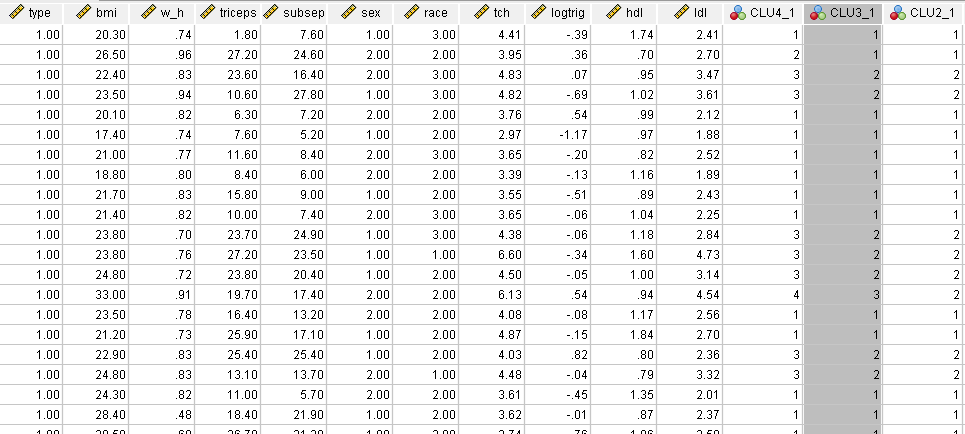
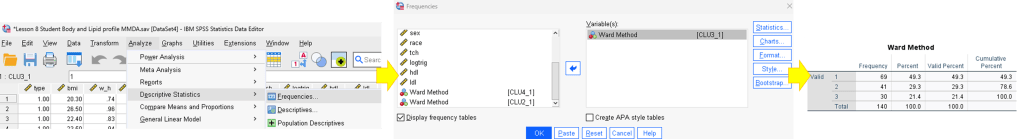
Step 6. Identify each cluster contain how many observations.
Step 7. Name each cluster.
Cluster 1 Independent variables mostly lowest, except hdl & ldl. Lowest lipid profile.
Cluster 2 Independent variables mostly moderate. Moderate lipid profile.
Cluster 3 Independent variables mostly highest, except hdl & ldl. Cluster 3 has high lipid profile except hdl & ldl.
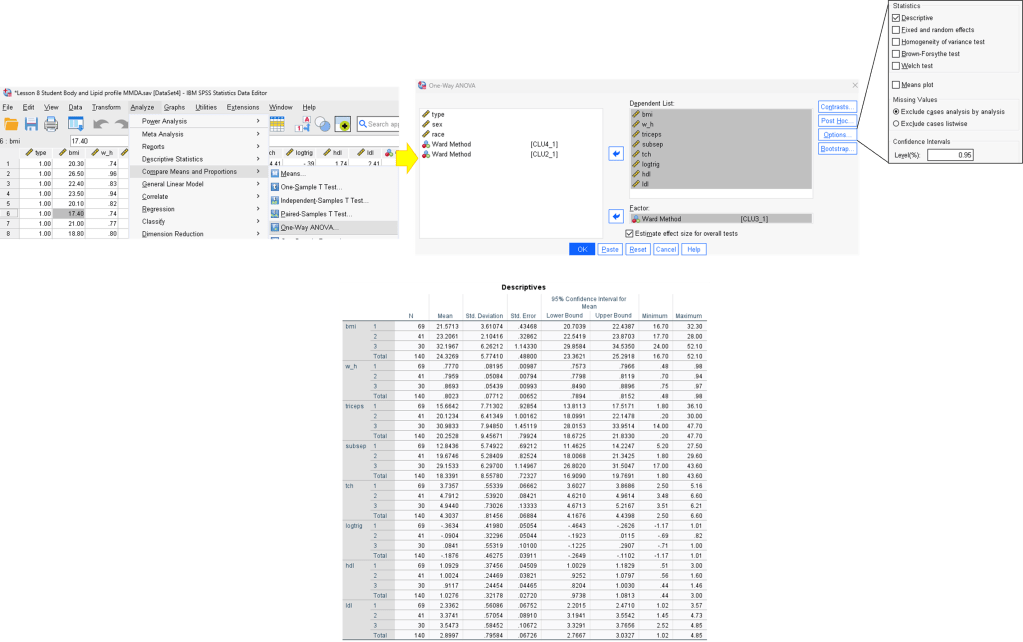
Step 8. Test mean value are same across all 3 cluster.
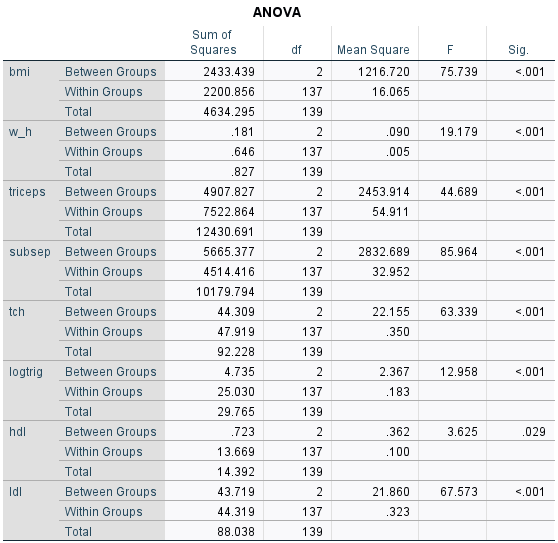
H0 : Mean of the clustering variables are the same across clusters.- If same, there are no variation between clusters.
H1 : At least one of the mean of the clustering variable differs from the other across clusters.
All of the independent variable Sig Value < 0.05; reject H0.
K-means Cluster
SPSS
Step 1. Bring up Cluster analysis dialog box.
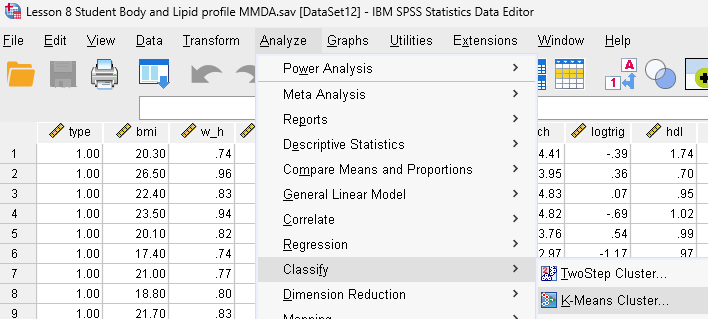
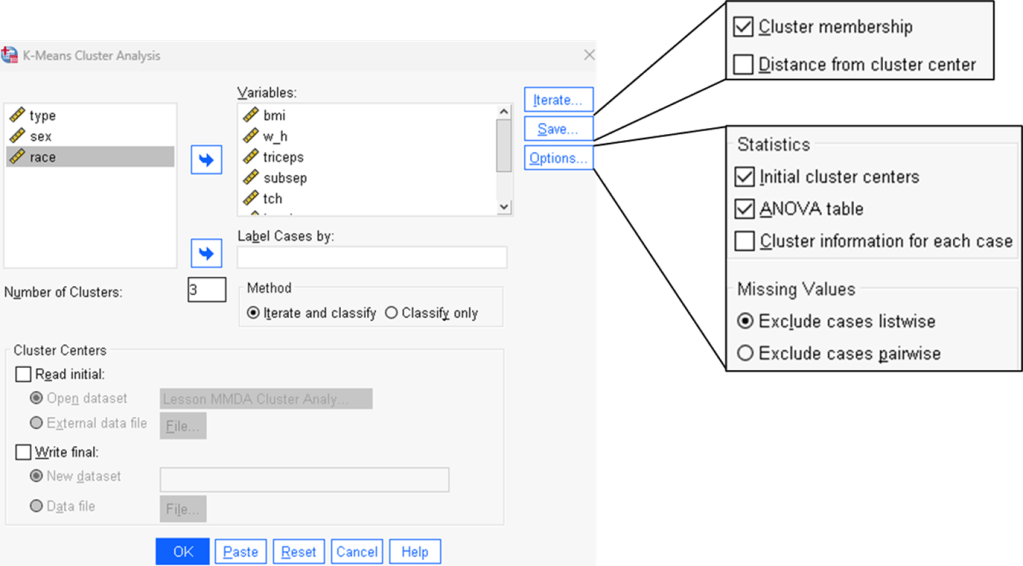
Step 2. Configure all cluster setup.
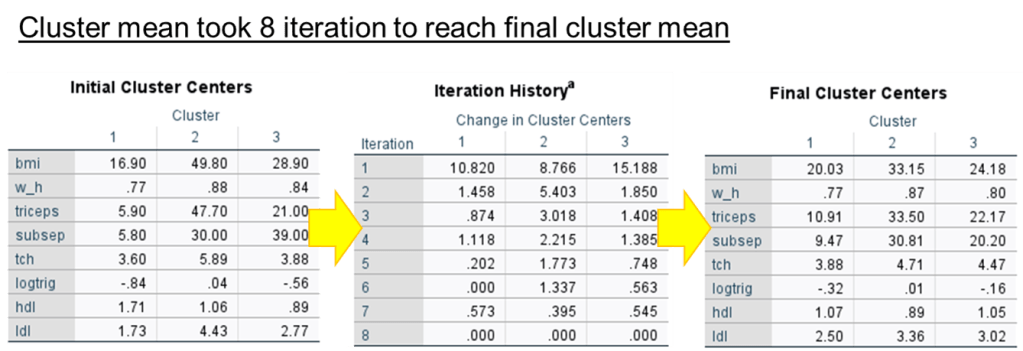
Step 3. Name each cluster.
Cluster 2 is high lipid profile except hdl.
Cluster 3 is moderate lipid profile.
Cluster 1 is low lipid profile except hdl.
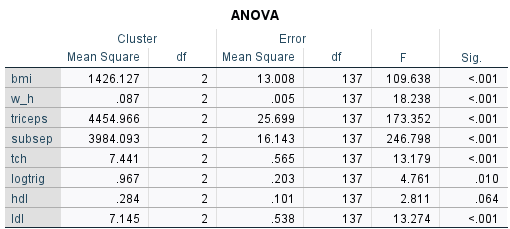
Step 4. Test mean value are same across all 3 cluster.
H0 : Mean of the cluster variables are equal across clusters.
H1 : At least one of the mean differs from across clusters.
All variable is significant except hdl. The mean of hdl is equal across cluster. Hdl is not a good clustering variable.
Most influential variable must look into “F” statistic. The largest belong to subsep having F statistic value of 246.798. Subsep is the most influential variable in deciding cluster. Hdl is the lowest influential variable in deciding the cluster, and share consistent p-value > 0.05.

Leave a comment