
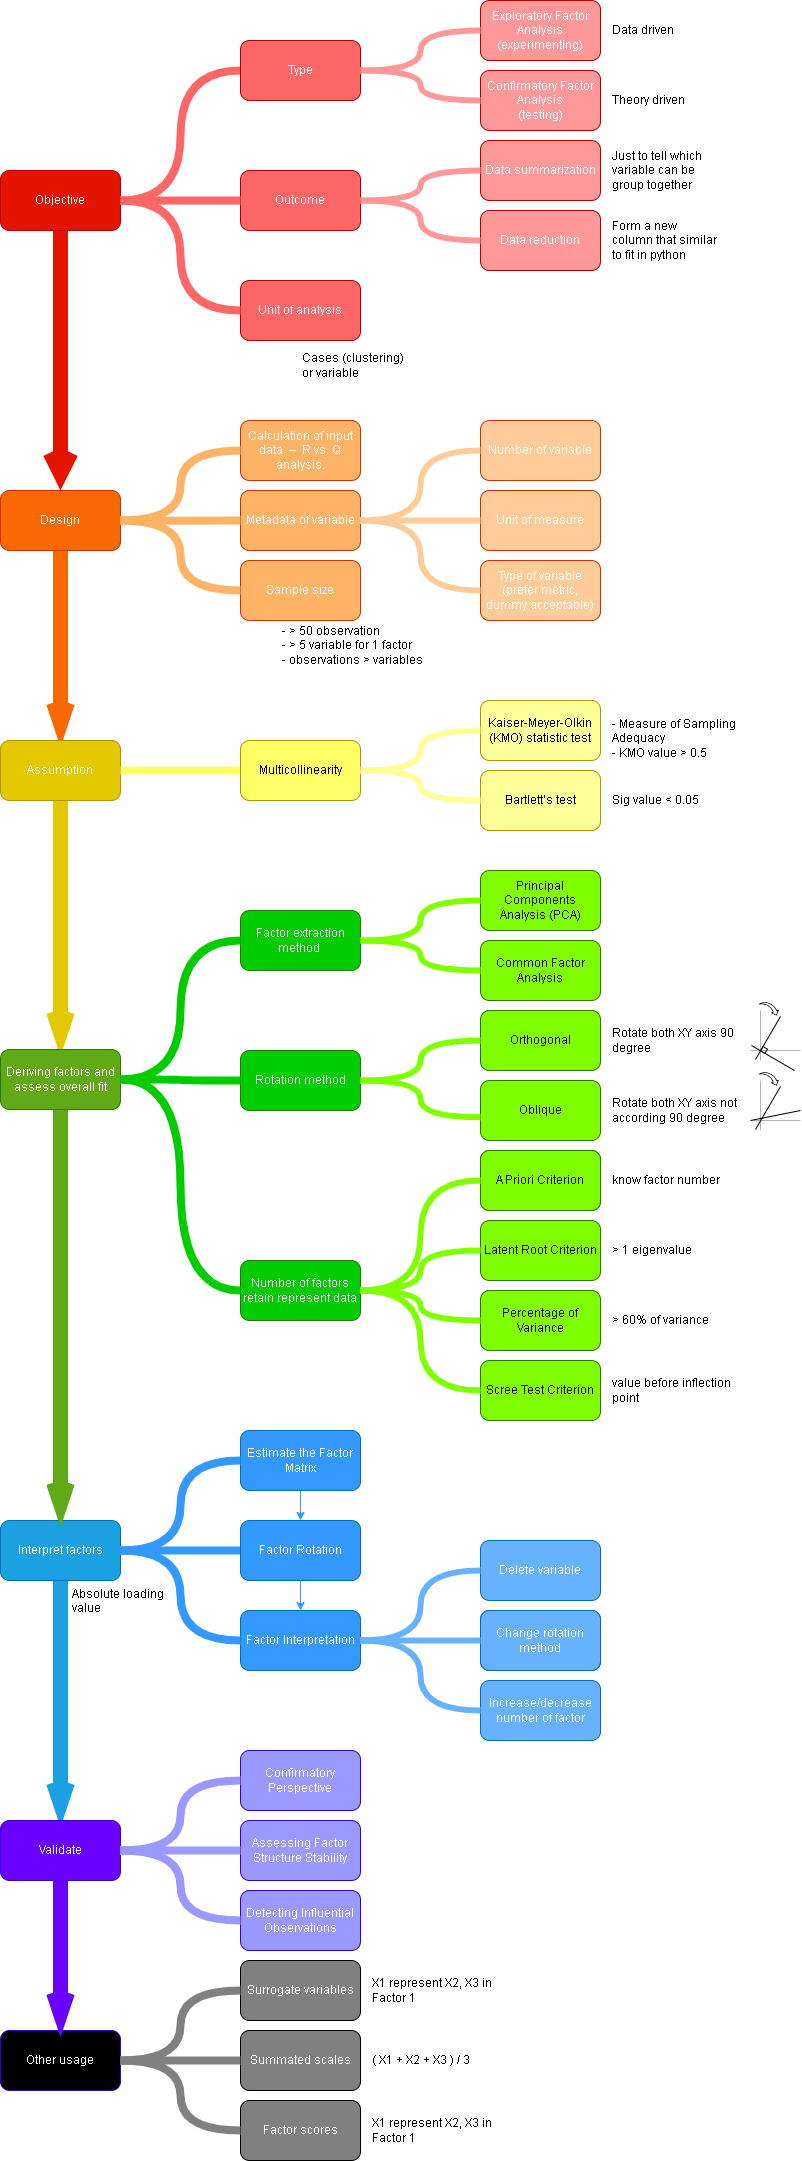
Factor Analysis
ps. Not looking the effect of 1 variable to another variable. Only looking at how to group variable together that form a common characteristics. Underlying structure also known as factor.
SPSS
Step 1. Bring up Factor analysis dialog box.

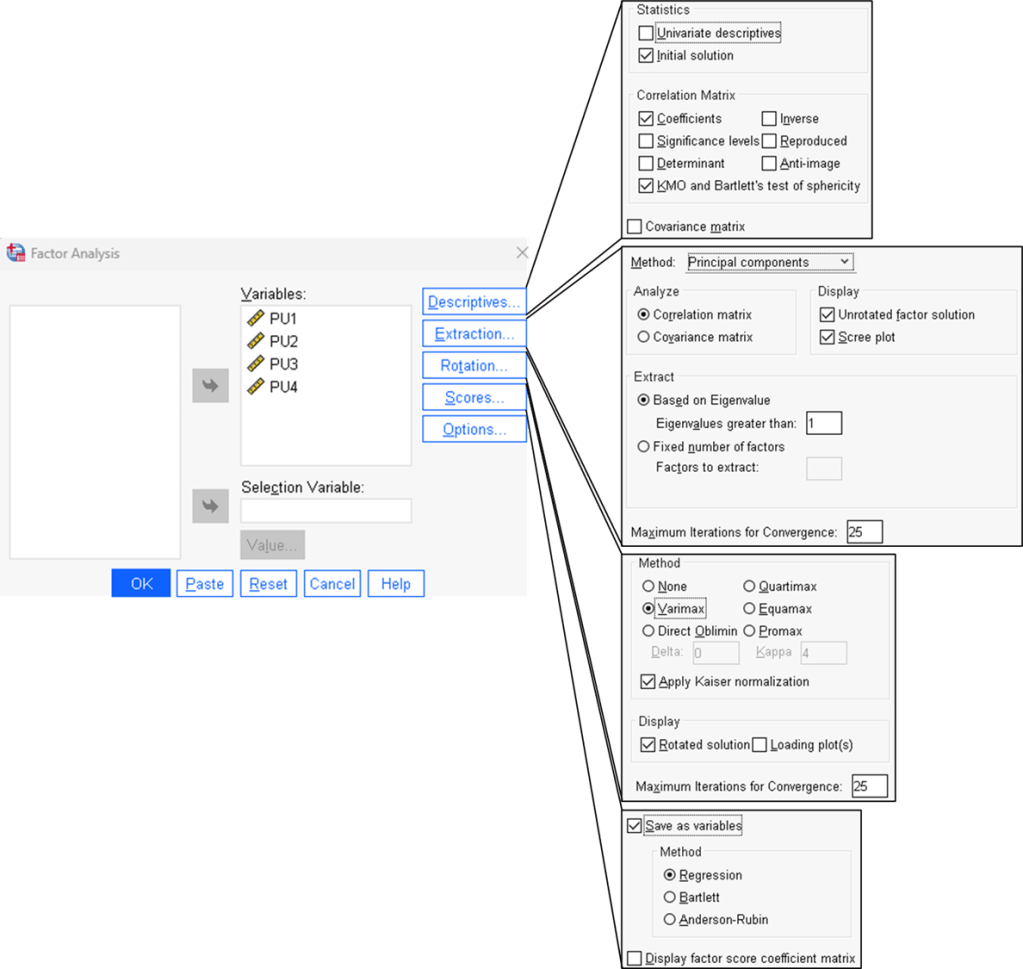
Step 2. Configure all factor setup.
Step 3. Correlation test result.
Relationship between 2 variable. Value should be around 0.3 – 0.85. If value outside desire range, drop the variable.


Step 4. KMO and Bartlett test result.
Measure the correlation between the variables.
Note that KMO measure of sampling adequacy must be 0.5 or higher. Variables in the dataset is correlated with one and another.
Bartlett test of sphericity p-value is < 0.05, indicate there is sufficient correlation in the variables.
Both KMO measure of sampling adequacy and Bartlett test of sphericity is meet.
Step 5. How much of the variance in variable A is share with other variable (B, C, D)


Step 6. Latent root criterion test result.
Explain how many factor was in the dataset.
Only 1 factor found as Total (eigenvalue) is 3.075, larger than 1. Factor 1 explain 76.8% of variance in the variables.
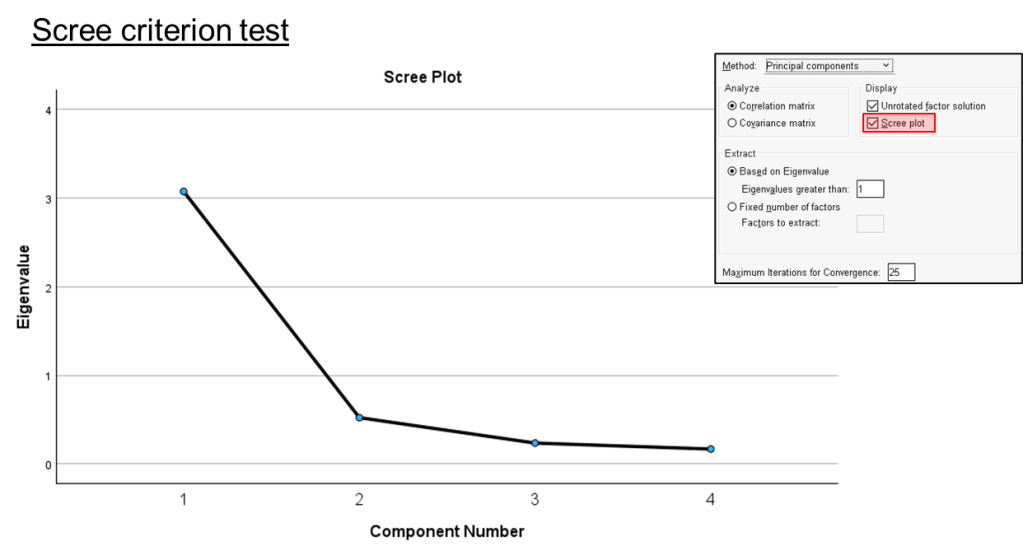
Step 7. Scree criterion test result.
Component number “2” shows inflection point (elbow pattern started)

Step 8. Factor loading.
Explain which variable is in which factor.
Base on the variable groups, possible naming could be “Quality of the system” or “Work efficiency”.
note, to PU1 can be chosen as the surrogate variable as it is 0.929 factor loading.
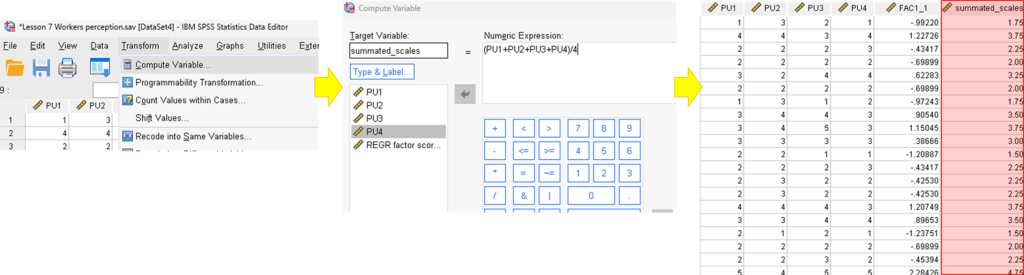
Step 9. summated scales

Leave a comment