
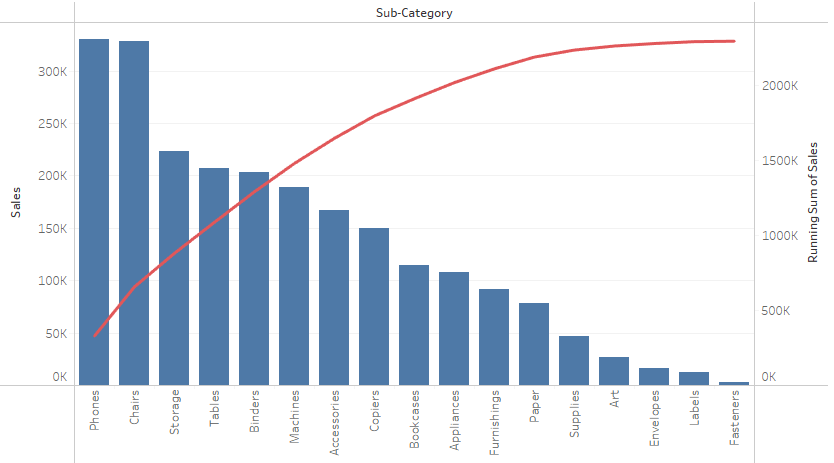
Pareto Chart
Tableau
Note:
– Overlay technique

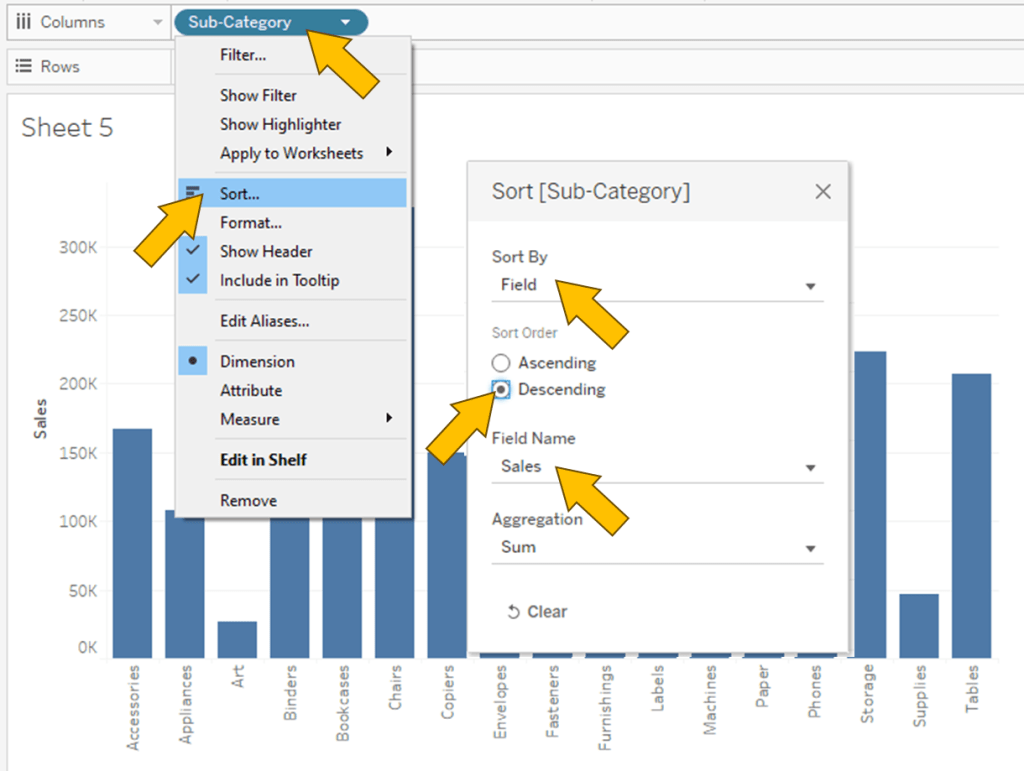
1. “Sub-Category” to Columns
2. “Sales” to Rows
3. Click on “Sub-Category” and select Sort…
4. In the Sort Menu, Change to Sort by Field, Sort Order Descending and Field Name is Sales.

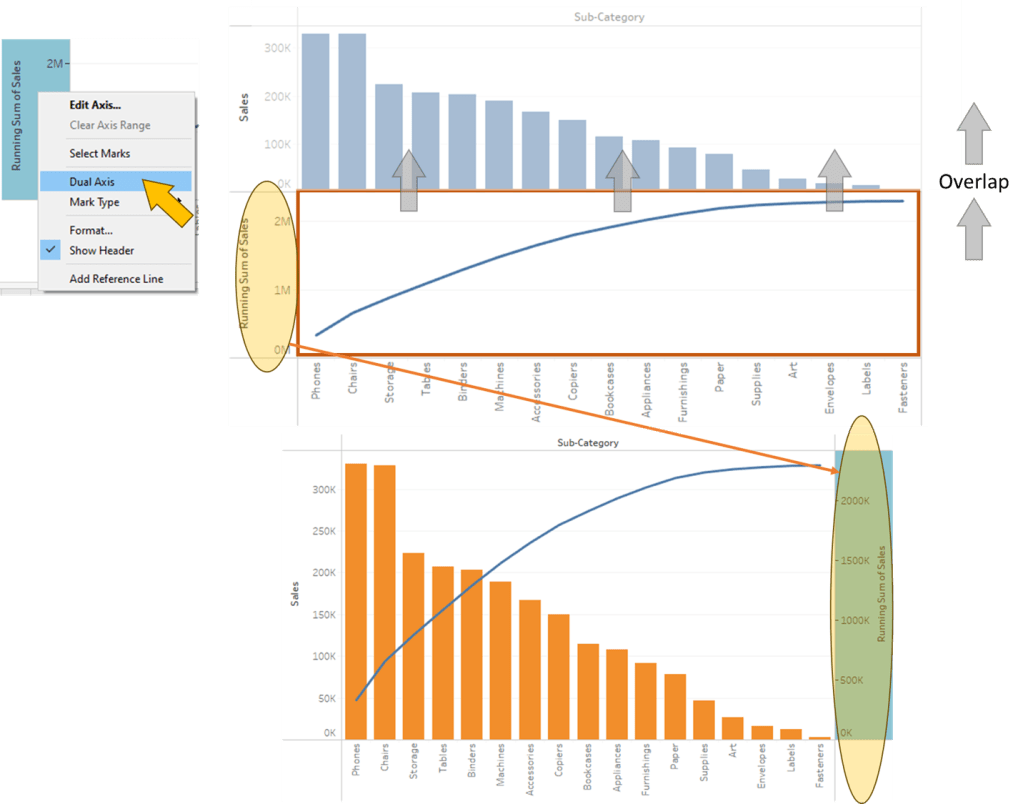
5. Do “Sales” again but this time Marks Line
6. Combine 2 plot together using Dual Axis
Spotfire

Note:
– In Combination Chart, no capability to sort X Axis by Value; only available in Bar chart

1. Click on Visualization Types button and select Combination chart
2. “Sub-Category” to X Axis
3. “Sales” to Y Axis, twice
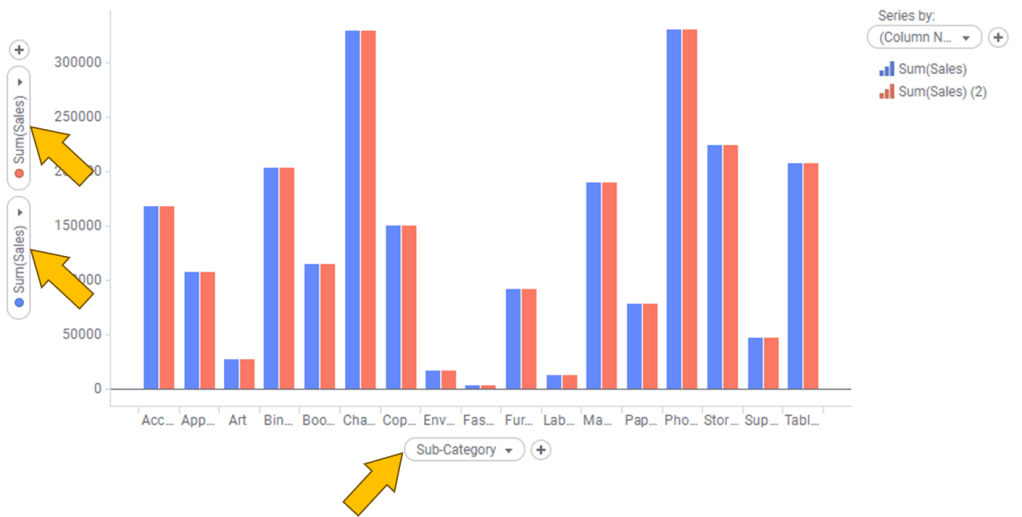
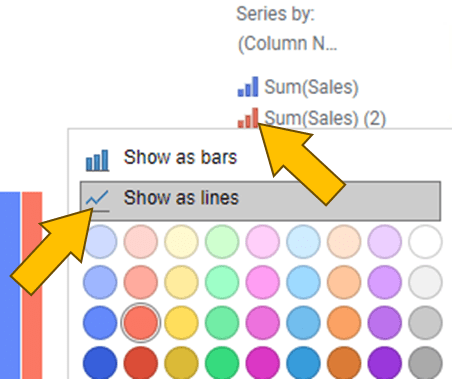
4. Head to legend and click on the small bar chart icon of “Sum(Sales) (2)”
5. Click on Show as lines
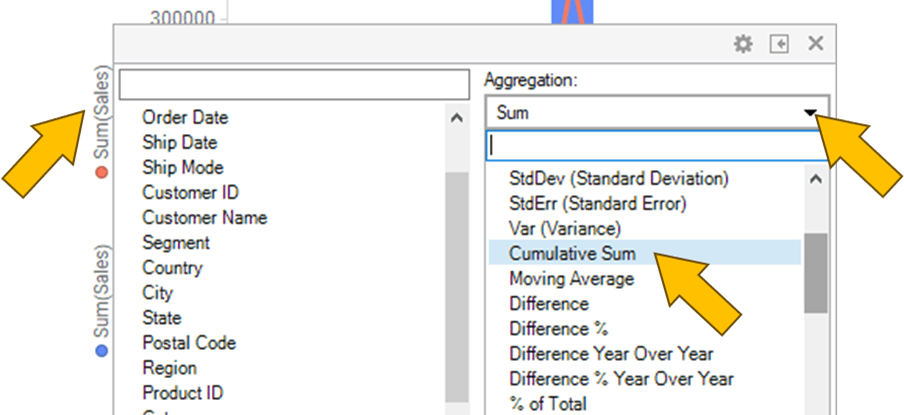
6. Click on “Sum(Sales)” on the X Axis, change Aggregation to Cumulative Sum

In Properties 🡒 Y Axis
7. Click on Dual scales
8. Move “Cumulative Sum (Sales)” to Right scale

Leave a comment