
Waterfall Chart
Tableau

Note:
– Uses starting position of Grantt Bar as anchor, negative value of size to expand the bar
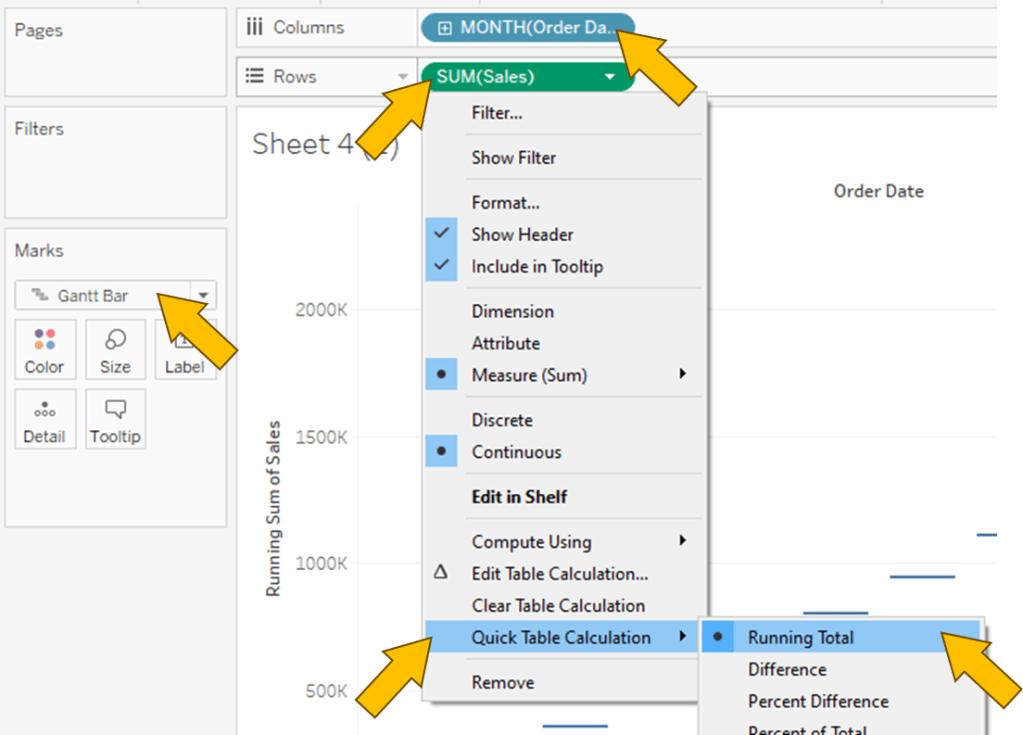
1. “Order Date” to Columns
2. “Sales” to Rows
3. Bar chart cannot be use as it always start from “0” aka bottom of chart
4. Grantt Bar however started at the value itself, only missing link will be the Bar itself.

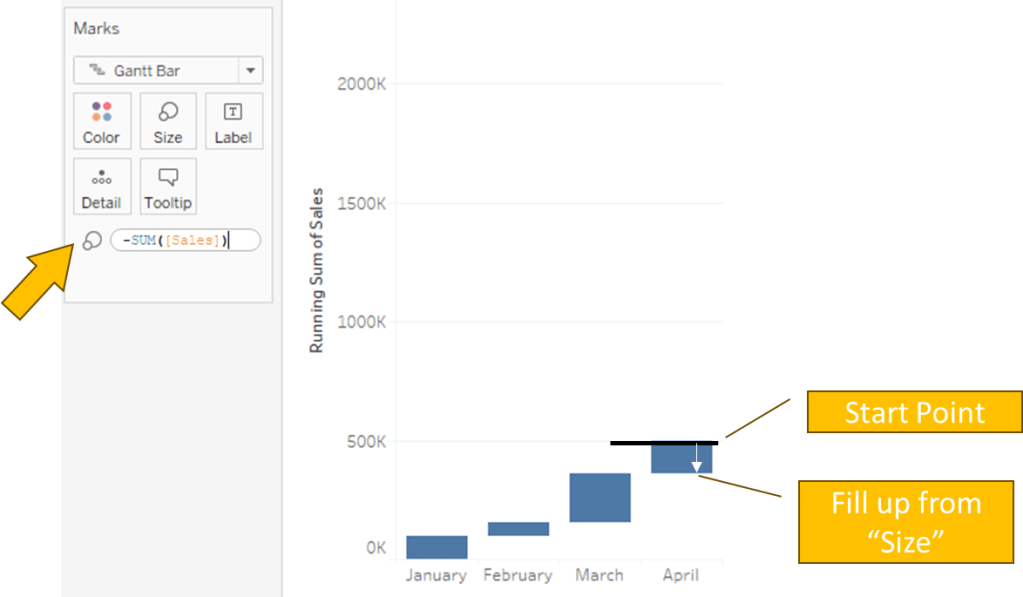
5. “-SUM([Sales])” to Size
Spotfire
Note:
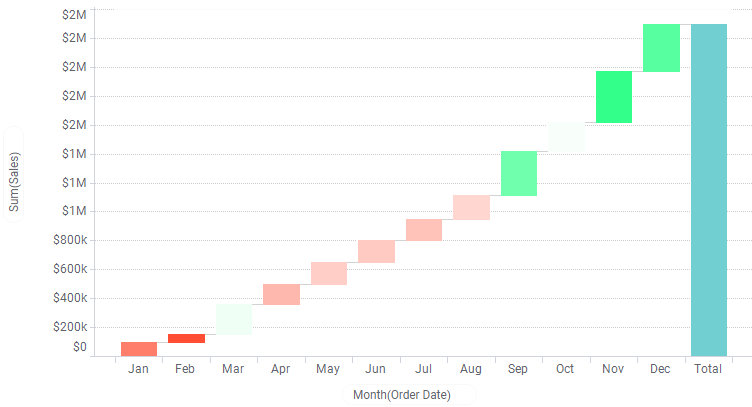
– Prebuilt Waferfall chart template

1. Click on Visualization Types button and select Waferfall chart
2. “Order Date” to X Axis
3. “Sales” to Y Axis


Leave a comment